Immigrants from the Azores vs Immigrants from Eastern Asia Professional Degree
COMPARE
Immigrants from the Azores
Immigrants from Eastern Asia
Professional Degree
Professional Degree Comparison
Immigrants from the Azores
Immigrants from Eastern Asia
2.8%
PROFESSIONAL DEGREE
0.0/ 100
METRIC RATING
342nd/ 347
METRIC RANK
6.6%
PROFESSIONAL DEGREE
100.0/ 100
METRIC RATING
17th/ 347
METRIC RANK
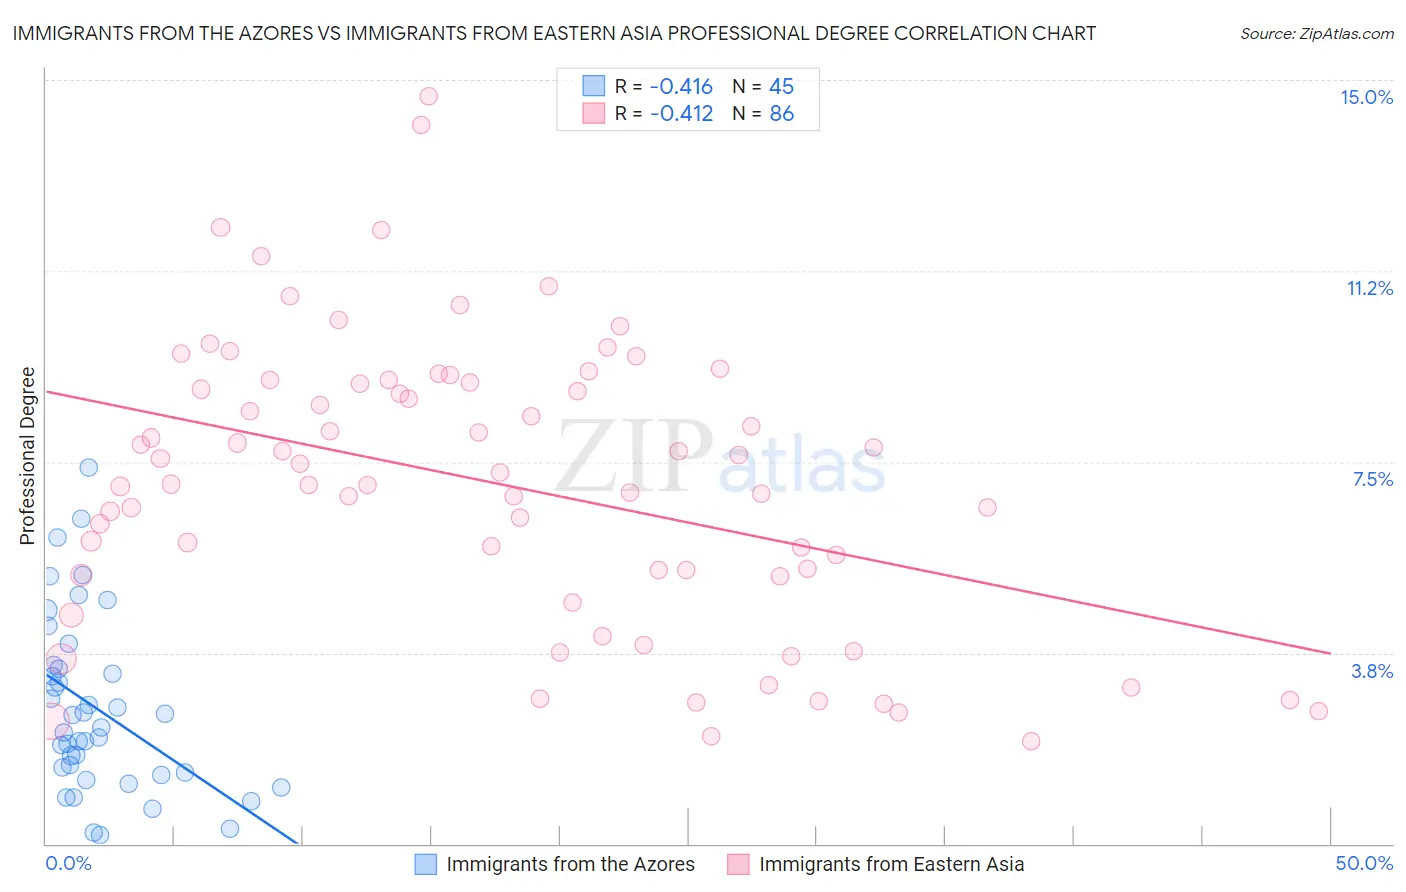
Immigrants from the Azores vs Immigrants from Eastern Asia Professional Degree Correlation Chart
The statistical analysis conducted on geographies consisting of 46,201,665 people shows a moderate negative correlation between the proportion of Immigrants from the Azores and percentage of population with at least professional degree education in the United States with a correlation coefficient (R) of -0.416 and weighted average of 2.8%. Similarly, the statistical analysis conducted on geographies consisting of 498,075,590 people shows a moderate negative correlation between the proportion of Immigrants from Eastern Asia and percentage of population with at least professional degree education in the United States with a correlation coefficient (R) of -0.412 and weighted average of 6.6%, a difference of 132.3%.
Professional Degree Correlation Summary
| Measurement | Immigrants from the Azores | Immigrants from Eastern Asia |
| Minimum | 0.17% | 2.0% |
| Maximum | 7.4% | 14.7% |
| Range | 7.2% | 12.7% |
| Mean | 2.7% | 7.1% |
| Median | 2.3% | 7.2% |
| Interquartile 25% (IQ1) | 1.4% | 5.3% |
| Interquartile 75% (IQ3) | 3.5% | 9.1% |
| Interquartile Range (IQR) | 2.1% | 3.8% |
| Standard Deviation (Sample) | 1.7% | 2.8% |
| Standard Deviation (Population) | 1.7% | 2.8% |
Similar Demographics by Professional Degree
Demographics Similar to Immigrants from the Azores by Professional Degree
In terms of professional degree, the demographic groups most similar to Immigrants from the Azores are Tohono O'odham (2.8%, a difference of 0.66%), Yup'ik (2.9%, a difference of 1.4%), Immigrants from Central America (2.9%, a difference of 1.5%), Navajo (2.9%, a difference of 1.6%), and Arapaho (2.9%, a difference of 1.7%).
| Demographics | Rating | Rank | Professional Degree |
| Puget Sound Salish | 0.0 /100 | #333 | Tragic 3.1% |
| Pennsylvania Germans | 0.0 /100 | #334 | Tragic 3.0% |
| Natives/Alaskans | 0.0 /100 | #335 | Tragic 3.0% |
| Fijians | 0.0 /100 | #336 | Tragic 2.9% |
| Arapaho | 0.0 /100 | #337 | Tragic 2.9% |
| Navajo | 0.0 /100 | #338 | Tragic 2.9% |
| Immigrants | Central America | 0.0 /100 | #339 | Tragic 2.9% |
| Yup'ik | 0.0 /100 | #340 | Tragic 2.9% |
| Tohono O'odham | 0.0 /100 | #341 | Tragic 2.8% |
| Immigrants | Azores | 0.0 /100 | #342 | Tragic 2.8% |
| Mexicans | 0.0 /100 | #343 | Tragic 2.7% |
| Spanish American Indians | 0.0 /100 | #344 | Tragic 2.7% |
| Immigrants | Mexico | 0.0 /100 | #345 | Tragic 2.6% |
| Lumbee | 0.0 /100 | #346 | Tragic 2.5% |
| Houma | 0.0 /100 | #347 | Tragic 2.2% |
Demographics Similar to Immigrants from Eastern Asia by Professional Degree
In terms of professional degree, the demographic groups most similar to Immigrants from Eastern Asia are Soviet Union (6.6%, a difference of 0.020%), Indian (Asian) (6.5%, a difference of 0.68%), Immigrants from Sweden (6.7%, a difference of 2.0%), Immigrants from Denmark (6.4%, a difference of 2.2%), and Immigrants from Hong Kong (6.4%, a difference of 2.5%).
| Demographics | Rating | Rank | Professional Degree |
| Immigrants | Belgium | 100.0 /100 | #10 | Exceptional 7.0% |
| Cypriots | 100.0 /100 | #11 | Exceptional 6.9% |
| Israelis | 100.0 /100 | #12 | Exceptional 6.9% |
| Immigrants | Australia | 100.0 /100 | #13 | Exceptional 6.9% |
| Immigrants | France | 100.0 /100 | #14 | Exceptional 6.8% |
| Immigrants | China | 100.0 /100 | #15 | Exceptional 6.7% |
| Immigrants | Sweden | 100.0 /100 | #16 | Exceptional 6.7% |
| Immigrants | Eastern Asia | 100.0 /100 | #17 | Exceptional 6.6% |
| Soviet Union | 100.0 /100 | #18 | Exceptional 6.6% |
| Indians (Asian) | 100.0 /100 | #19 | Exceptional 6.5% |
| Immigrants | Denmark | 100.0 /100 | #20 | Exceptional 6.4% |
| Immigrants | Hong Kong | 100.0 /100 | #21 | Exceptional 6.4% |
| Immigrants | Japan | 100.0 /100 | #22 | Exceptional 6.4% |
| Russians | 100.0 /100 | #23 | Exceptional 6.3% |
| Immigrants | Spain | 100.0 /100 | #24 | Exceptional 6.3% |