Immigrants from Bahamas vs Immigrants from Eastern Asia 2nd Grade
COMPARE
Immigrants from Bahamas
Immigrants from Eastern Asia
2nd Grade
2nd Grade Comparison
Immigrants from Bahamas
Immigrants from Eastern Asia
97.7%
2ND GRADE
8.4/ 100
METRIC RATING
212th/ 347
METRIC RANK
97.6%
2ND GRADE
1.6/ 100
METRIC RATING
238th/ 347
METRIC RANK
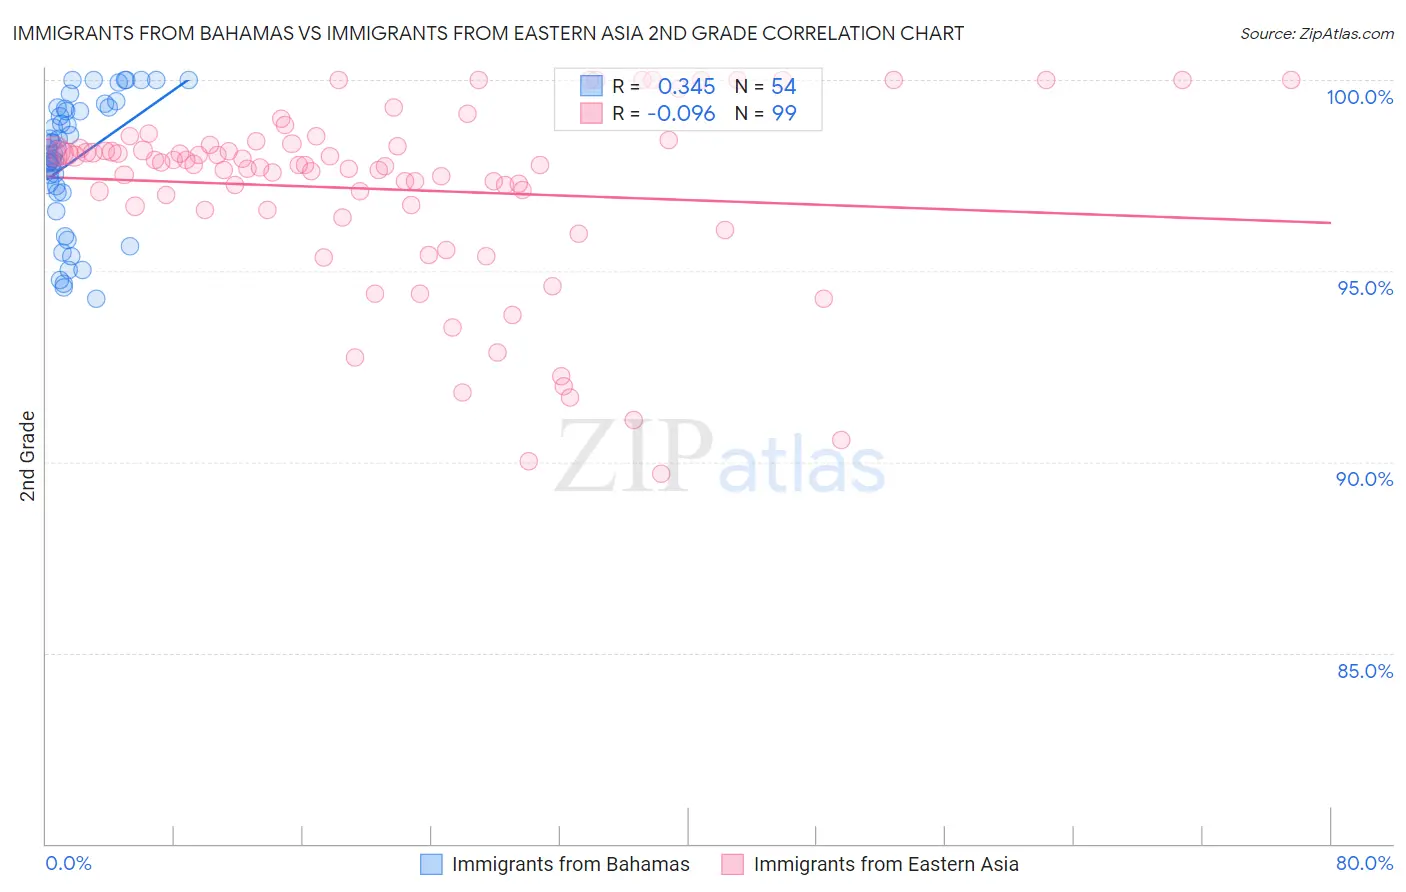
Immigrants from Bahamas vs Immigrants from Eastern Asia 2nd Grade Correlation Chart
The statistical analysis conducted on geographies consisting of 104,666,627 people shows a mild positive correlation between the proportion of Immigrants from Bahamas and percentage of population with at least 2nd grade education in the United States with a correlation coefficient (R) of 0.345 and weighted average of 97.7%. Similarly, the statistical analysis conducted on geographies consisting of 499,865,893 people shows a slight negative correlation between the proportion of Immigrants from Eastern Asia and percentage of population with at least 2nd grade education in the United States with a correlation coefficient (R) of -0.096 and weighted average of 97.6%, a difference of 0.13%.
2nd Grade Correlation Summary
| Measurement | Immigrants from Bahamas | Immigrants from Eastern Asia |
| Minimum | 94.3% | 89.7% |
| Maximum | 100.0% | 100.0% |
| Range | 5.7% | 10.3% |
| Mean | 97.9% | 97.1% |
| Median | 98.1% | 97.8% |
| Interquartile 25% (IQ1) | 97.1% | 96.6% |
| Interquartile 75% (IQ3) | 99.2% | 98.3% |
| Interquartile Range (IQR) | 2.2% | 1.7% |
| Standard Deviation (Sample) | 1.7% | 2.4% |
| Standard Deviation (Population) | 1.7% | 2.4% |
Similar Demographics by 2nd Grade
Demographics Similar to Immigrants from Bahamas by 2nd Grade
In terms of 2nd grade, the demographic groups most similar to Immigrants from Bahamas are Moroccan (97.7%, a difference of 0.0%), Laotian (97.7%, a difference of 0.010%), Samoan (97.7%, a difference of 0.010%), Immigrants from Oceania (97.7%, a difference of 0.020%), and Costa Rican (97.7%, a difference of 0.020%).
| Demographics | Rating | Rank | 2nd Grade |
| Immigrants | Southern Europe | 18.1 /100 | #205 | Poor 97.8% |
| Immigrants | Chile | 17.3 /100 | #206 | Poor 97.7% |
| Africans | 15.6 /100 | #207 | Poor 97.7% |
| Immigrants | Northern Africa | 12.3 /100 | #208 | Poor 97.7% |
| Immigrants | Oceania | 10.9 /100 | #209 | Poor 97.7% |
| Costa Ricans | 10.5 /100 | #210 | Poor 97.7% |
| Laotians | 9.9 /100 | #211 | Tragic 97.7% |
| Immigrants | Bahamas | 8.4 /100 | #212 | Tragic 97.7% |
| Moroccans | 8.2 /100 | #213 | Tragic 97.7% |
| Samoans | 7.1 /100 | #214 | Tragic 97.7% |
| Bahamians | 6.8 /100 | #215 | Tragic 97.7% |
| South American Indians | 6.7 /100 | #216 | Tragic 97.7% |
| Uruguayans | 6.2 /100 | #217 | Tragic 97.7% |
| Sudanese | 5.7 /100 | #218 | Tragic 97.7% |
| Immigrants | Panama | 5.1 /100 | #219 | Tragic 97.6% |
Demographics Similar to Immigrants from Eastern Asia by 2nd Grade
In terms of 2nd grade, the demographic groups most similar to Immigrants from Eastern Asia are Nigerian (97.6%, a difference of 0.0%), U.S. Virgin Islander (97.6%, a difference of 0.0%), Liberian (97.6%, a difference of 0.0%), Colombian (97.6%, a difference of 0.010%), and Korean (97.5%, a difference of 0.010%).
| Demographics | Rating | Rank | 2nd Grade |
| Immigrants | Pakistan | 2.3 /100 | #231 | Tragic 97.6% |
| Immigrants | Western Asia | 2.1 /100 | #232 | Tragic 97.6% |
| Immigrants | Uruguay | 2.1 /100 | #233 | Tragic 97.6% |
| Immigrants | Malaysia | 2.0 /100 | #234 | Tragic 97.6% |
| Colombians | 1.9 /100 | #235 | Tragic 97.6% |
| Nigerians | 1.7 /100 | #236 | Tragic 97.6% |
| U.S. Virgin Islanders | 1.6 /100 | #237 | Tragic 97.6% |
| Immigrants | Eastern Asia | 1.6 /100 | #238 | Tragic 97.6% |
| Liberians | 1.6 /100 | #239 | Tragic 97.6% |
| Koreans | 1.5 /100 | #240 | Tragic 97.5% |
| Ethiopians | 1.2 /100 | #241 | Tragic 97.5% |
| Immigrants | Indonesia | 1.2 /100 | #242 | Tragic 97.5% |
| Asians | 1.1 /100 | #243 | Tragic 97.5% |
| Immigrants | Iraq | 1.0 /100 | #244 | Tragic 97.5% |
| Immigrants | Eastern Africa | 0.9 /100 | #245 | Tragic 97.5% |