Immigrants from Bahamas vs Colombian Bachelor's Degree
COMPARE
Immigrants from Bahamas
Colombian
Bachelor's Degree
Bachelor's Degree Comparison
Immigrants from Bahamas
Colombians
33.3%
BACHELOR'S DEGREE
0.7/ 100
METRIC RATING
252nd/ 347
METRIC RANK
38.4%
BACHELOR'S DEGREE
65.0/ 100
METRIC RATING
162nd/ 347
METRIC RANK
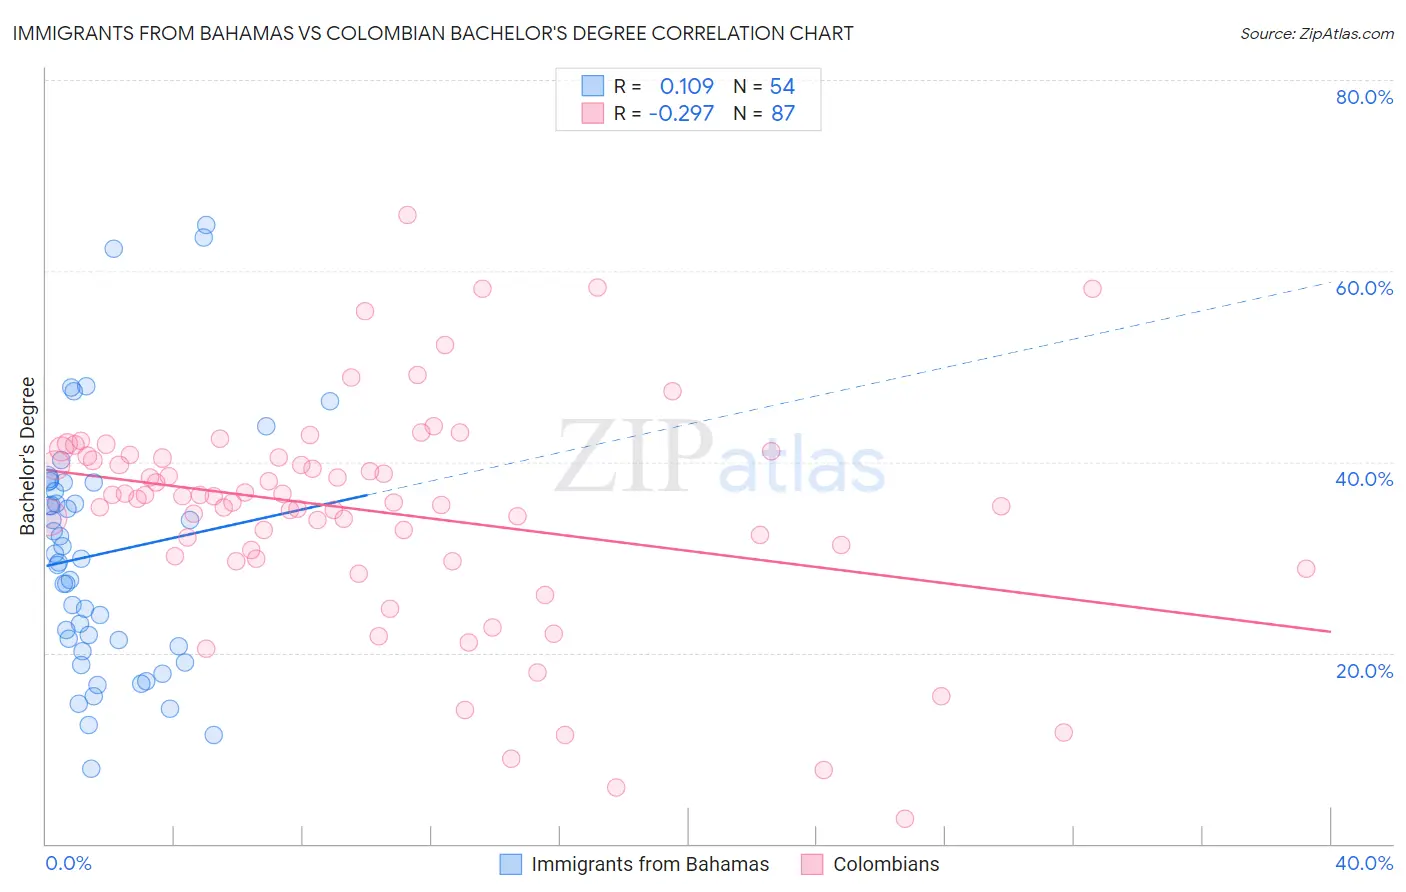
Immigrants from Bahamas vs Colombian Bachelor's Degree Correlation Chart
The statistical analysis conducted on geographies consisting of 104,662,355 people shows a poor positive correlation between the proportion of Immigrants from Bahamas and percentage of population with at least bachelor's degree education in the United States with a correlation coefficient (R) of 0.109 and weighted average of 33.3%. Similarly, the statistical analysis conducted on geographies consisting of 419,636,892 people shows a weak negative correlation between the proportion of Colombians and percentage of population with at least bachelor's degree education in the United States with a correlation coefficient (R) of -0.297 and weighted average of 38.4%, a difference of 15.3%.
Bachelor's Degree Correlation Summary
| Measurement | Immigrants from Bahamas | Colombian |
| Minimum | 7.9% | 2.6% |
| Maximum | 64.8% | 65.8% |
| Range | 56.9% | 63.3% |
| Mean | 30.4% | 34.8% |
| Median | 29.6% | 36.4% |
| Interquartile 25% (IQ1) | 20.7% | 30.1% |
| Interquartile 75% (IQ3) | 37.8% | 40.6% |
| Interquartile Range (IQR) | 17.1% | 10.5% |
| Standard Deviation (Sample) | 12.9% | 11.6% |
| Standard Deviation (Population) | 12.8% | 11.6% |
Similar Demographics by Bachelor's Degree
Demographics Similar to Immigrants from Bahamas by Bachelor's Degree
In terms of bachelor's degree, the demographic groups most similar to Immigrants from Bahamas are Japanese (33.3%, a difference of 0.070%), U.S. Virgin Islander (33.2%, a difference of 0.21%), Native Hawaiian (33.2%, a difference of 0.27%), Iroquois (33.2%, a difference of 0.28%), and Nicaraguan (33.1%, a difference of 0.47%).
| Demographics | Rating | Rank | Bachelor's Degree |
| Immigrants | Fiji | 1.2 /100 | #245 | Tragic 33.7% |
| Jamaicans | 1.0 /100 | #246 | Tragic 33.6% |
| Immigrants | Congo | 1.0 /100 | #247 | Tragic 33.6% |
| Cree | 1.0 /100 | #248 | Tragic 33.6% |
| Immigrants | Liberia | 0.9 /100 | #249 | Tragic 33.5% |
| Indonesians | 0.9 /100 | #250 | Tragic 33.5% |
| Japanese | 0.7 /100 | #251 | Tragic 33.3% |
| Immigrants | Bahamas | 0.7 /100 | #252 | Tragic 33.3% |
| U.S. Virgin Islanders | 0.7 /100 | #253 | Tragic 33.2% |
| Native Hawaiians | 0.7 /100 | #254 | Tragic 33.2% |
| Iroquois | 0.7 /100 | #255 | Tragic 33.2% |
| Nicaraguans | 0.6 /100 | #256 | Tragic 33.1% |
| Spanish Americans | 0.6 /100 | #257 | Tragic 33.1% |
| French American Indians | 0.6 /100 | #258 | Tragic 33.1% |
| Osage | 0.5 /100 | #259 | Tragic 33.0% |
Demographics Similar to Colombians by Bachelor's Degree
In terms of bachelor's degree, the demographic groups most similar to Colombians are Uruguayan (38.4%, a difference of 0.080%), Vietnamese (38.5%, a difference of 0.16%), Chinese (38.5%, a difference of 0.17%), Peruvian (38.3%, a difference of 0.17%), and Hungarian (38.3%, a difference of 0.31%).
| Demographics | Rating | Rank | Bachelor's Degree |
| Immigrants | Kenya | 73.8 /100 | #155 | Good 38.8% |
| Kenyans | 72.5 /100 | #156 | Good 38.7% |
| Immigrants | South America | 70.1 /100 | #157 | Good 38.6% |
| Immigrants | Germany | 69.6 /100 | #158 | Good 38.6% |
| Chinese | 66.6 /100 | #159 | Good 38.5% |
| Vietnamese | 66.6 /100 | #160 | Good 38.5% |
| Uruguayans | 65.8 /100 | #161 | Good 38.4% |
| Colombians | 65.0 /100 | #162 | Good 38.4% |
| Peruvians | 63.4 /100 | #163 | Good 38.3% |
| Hungarians | 62.1 /100 | #164 | Good 38.3% |
| Sri Lankans | 59.1 /100 | #165 | Average 38.2% |
| Somalis | 58.6 /100 | #166 | Average 38.1% |
| Scottish | 56.6 /100 | #167 | Average 38.1% |
| Danes | 56.2 /100 | #168 | Average 38.1% |
| Ghanaians | 55.3 /100 | #169 | Average 38.0% |