Immigrants from the Azores vs Scottish 4th Grade
COMPARE
Immigrants from the Azores
Scottish
4th Grade
4th Grade Comparison
Immigrants from the Azores
Scottish
96.1%
4TH GRADE
0.0/ 100
METRIC RATING
318th/ 347
METRIC RANK
98.4%
4TH GRADE
100.0/ 100
METRIC RATING
16th/ 347
METRIC RANK
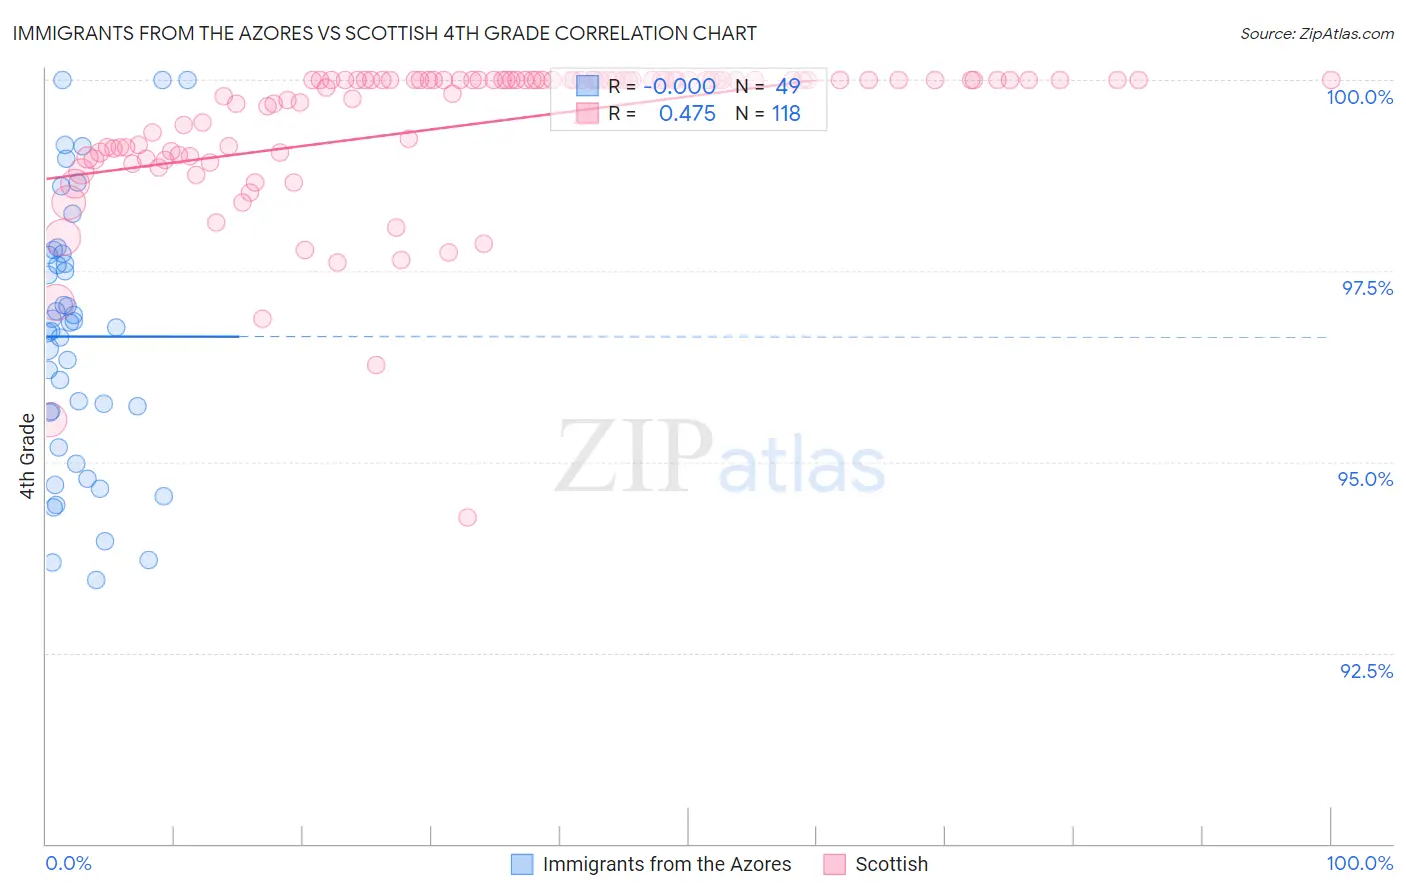
Immigrants from the Azores vs Scottish 4th Grade Correlation Chart
The statistical analysis conducted on geographies consisting of 46,257,310 people shows no correlation between the proportion of Immigrants from the Azores and percentage of population with at least 4th grade education in the United States with a correlation coefficient (R) of -0.000 and weighted average of 96.1%. Similarly, the statistical analysis conducted on geographies consisting of 567,141,733 people shows a moderate positive correlation between the proportion of Scottish and percentage of population with at least 4th grade education in the United States with a correlation coefficient (R) of 0.475 and weighted average of 98.4%, a difference of 2.3%.
4th Grade Correlation Summary
| Measurement | Immigrants from the Azores | Scottish |
| Minimum | 93.4% | 94.3% |
| Maximum | 100.0% | 100.0% |
| Range | 6.6% | 5.7% |
| Mean | 96.6% | 99.4% |
| Median | 96.8% | 100.0% |
| Interquartile 25% (IQ1) | 95.4% | 99.0% |
| Interquartile 75% (IQ3) | 97.7% | 100.0% |
| Interquartile Range (IQR) | 2.3% | 0.98% |
| Standard Deviation (Sample) | 1.7% | 0.99% |
| Standard Deviation (Population) | 1.7% | 0.99% |
Similar Demographics by 4th Grade
Demographics Similar to Immigrants from the Azores by 4th Grade
In terms of 4th grade, the demographic groups most similar to Immigrants from the Azores are Belizean (96.1%, a difference of 0.020%), Central American Indian (96.2%, a difference of 0.040%), Bangladeshi (96.1%, a difference of 0.040%), Immigrants from Ecuador (96.2%, a difference of 0.080%), and Vietnamese (96.2%, a difference of 0.090%).
| Demographics | Rating | Rank | 4th Grade |
| Immigrants | Bangladesh | 0.0 /100 | #311 | Tragic 96.2% |
| Cape Verdeans | 0.0 /100 | #312 | Tragic 96.2% |
| Indonesians | 0.0 /100 | #313 | Tragic 96.2% |
| Vietnamese | 0.0 /100 | #314 | Tragic 96.2% |
| Nicaraguans | 0.0 /100 | #315 | Tragic 96.2% |
| Immigrants | Ecuador | 0.0 /100 | #316 | Tragic 96.2% |
| Central American Indians | 0.0 /100 | #317 | Tragic 96.2% |
| Immigrants | Azores | 0.0 /100 | #318 | Tragic 96.1% |
| Belizeans | 0.0 /100 | #319 | Tragic 96.1% |
| Bangladeshis | 0.0 /100 | #320 | Tragic 96.1% |
| Japanese | 0.0 /100 | #321 | Tragic 96.0% |
| Immigrants | Vietnam | 0.0 /100 | #322 | Tragic 96.0% |
| Immigrants | Nicaragua | 0.0 /100 | #323 | Tragic 96.0% |
| Immigrants | Belize | 0.0 /100 | #324 | Tragic 96.0% |
| Dominicans | 0.0 /100 | #325 | Tragic 96.0% |
Demographics Similar to Scottish by 4th Grade
In terms of 4th grade, the demographic groups most similar to Scottish are Dutch (98.4%, a difference of 0.0%), Pennsylvania German (98.4%, a difference of 0.0%), Polish (98.4%, a difference of 0.010%), Irish (98.4%, a difference of 0.010%), and Alaska Native (98.4%, a difference of 0.020%).
| Demographics | Rating | Rank | 4th Grade |
| Slovenes | 100.0 /100 | #9 | Exceptional 98.4% |
| Alaskan Athabascans | 100.0 /100 | #10 | Exceptional 98.4% |
| English | 100.0 /100 | #11 | Exceptional 98.4% |
| Tlingit-Haida | 100.0 /100 | #12 | Exceptional 98.4% |
| Swedes | 100.0 /100 | #13 | Exceptional 98.4% |
| Carpatho Rusyns | 100.0 /100 | #14 | Exceptional 98.4% |
| Dutch | 100.0 /100 | #15 | Exceptional 98.4% |
| Scottish | 100.0 /100 | #16 | Exceptional 98.4% |
| Pennsylvania Germans | 100.0 /100 | #17 | Exceptional 98.4% |
| Poles | 100.0 /100 | #18 | Exceptional 98.4% |
| Irish | 100.0 /100 | #19 | Exceptional 98.4% |
| Alaska Natives | 100.0 /100 | #20 | Exceptional 98.4% |
| Lithuanians | 100.0 /100 | #21 | Exceptional 98.3% |
| Finns | 100.0 /100 | #22 | Exceptional 98.3% |
| Sioux | 100.0 /100 | #23 | Exceptional 98.3% |