Immigrants from Australia vs Immigrants from Uzbekistan Unemployment Among Ages 20 to 24 years
COMPARE
Immigrants from Australia
Immigrants from Uzbekistan
Unemployment Among Ages 20 to 24 years
Unemployment Among Ages 20 to 24 years Comparison
Immigrants from Australia
Immigrants from Uzbekistan
9.9%
UNEMPLOYMENT AMONG AGES 20 TO 24 YEARS
98.6/ 100
METRIC RATING
75th/ 347
METRIC RANK
11.4%
UNEMPLOYMENT AMONG AGES 20 TO 24 YEARS
0.0/ 100
METRIC RATING
271st/ 347
METRIC RANK
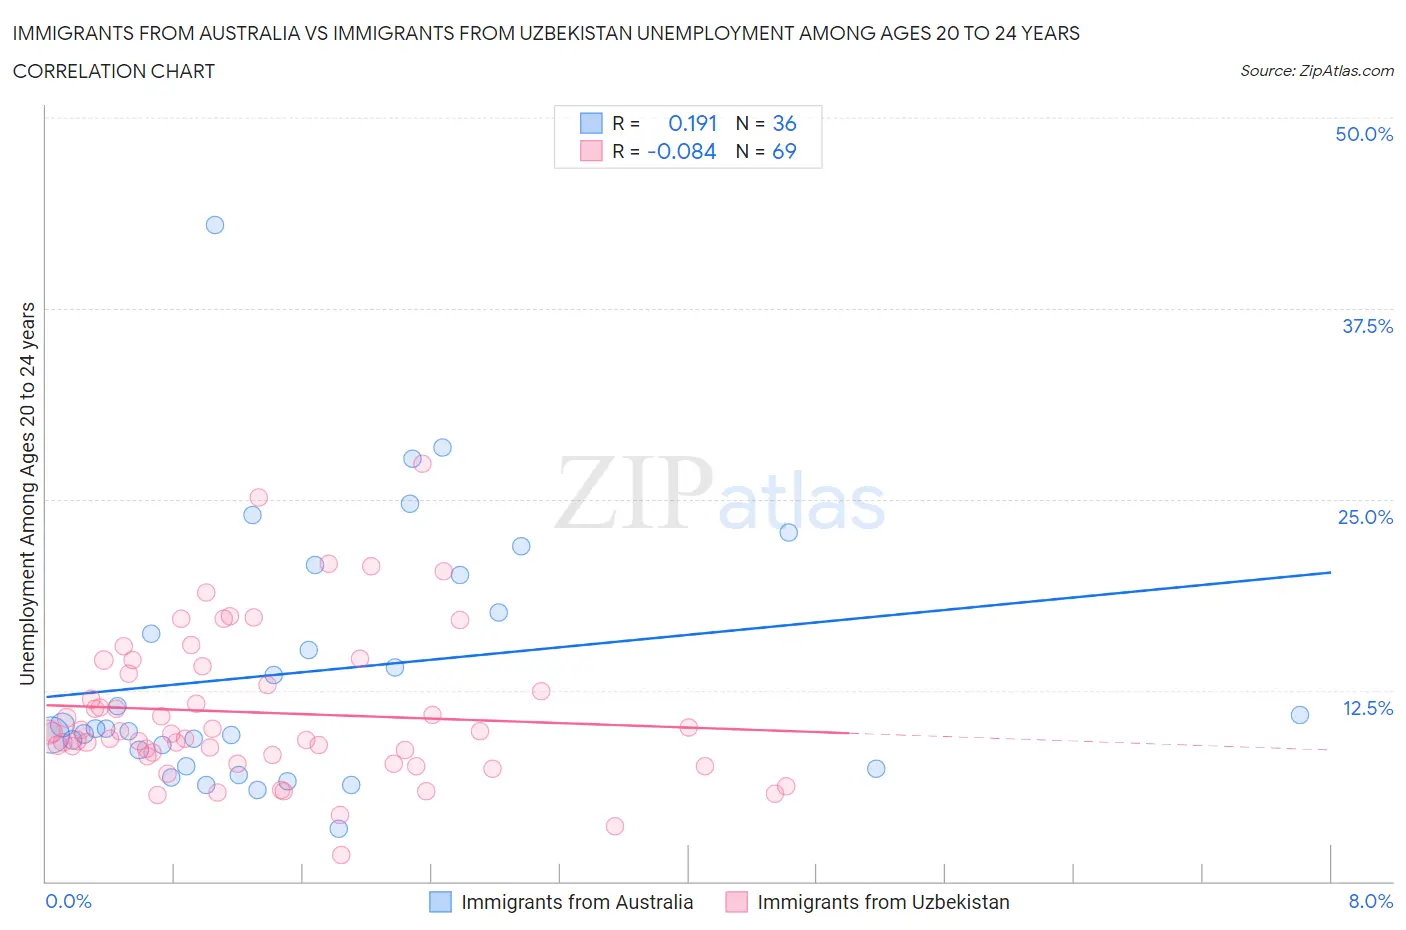
Immigrants from Australia vs Immigrants from Uzbekistan Unemployment Among Ages 20 to 24 years Correlation Chart
The statistical analysis conducted on geographies consisting of 222,859,842 people shows a poor positive correlation between the proportion of Immigrants from Australia and unemployment rate among population between the ages 20 and 24 in the United States with a correlation coefficient (R) of 0.191 and weighted average of 9.9%. Similarly, the statistical analysis conducted on geographies consisting of 117,531,757 people shows a slight negative correlation between the proportion of Immigrants from Uzbekistan and unemployment rate among population between the ages 20 and 24 in the United States with a correlation coefficient (R) of -0.084 and weighted average of 11.4%, a difference of 15.1%.
Unemployment Among Ages 20 to 24 years Correlation Summary
| Measurement | Immigrants from Australia | Immigrants from Uzbekistan |
| Minimum | 3.4% | 1.7% |
| Maximum | 43.0% | 27.3% |
| Range | 39.6% | 25.6% |
| Mean | 13.7% | 11.0% |
| Median | 10.0% | 9.8% |
| Interquartile 25% (IQ1) | 8.1% | 8.2% |
| Interquartile 75% (IQ3) | 18.8% | 13.8% |
| Interquartile Range (IQR) | 10.8% | 5.6% |
| Standard Deviation (Sample) | 8.4% | 4.9% |
| Standard Deviation (Population) | 8.3% | 4.9% |
Similar Demographics by Unemployment Among Ages 20 to 24 years
Demographics Similar to Immigrants from Australia by Unemployment Among Ages 20 to 24 years
In terms of unemployment among ages 20 to 24 years, the demographic groups most similar to Immigrants from Australia are Immigrants from Laos (9.9%, a difference of 0.070%), Czechoslovakian (9.9%, a difference of 0.090%), Kenyan (9.9%, a difference of 0.10%), Chickasaw (9.9%, a difference of 0.11%), and Assyrian/Chaldean/Syriac (9.9%, a difference of 0.14%).
| Demographics | Rating | Rank | Unemployment Among Ages 20 to 24 years |
| Mongolians | 99.1 /100 | #68 | Exceptional 9.9% |
| Bulgarians | 99.1 /100 | #69 | Exceptional 9.9% |
| Immigrants | Croatia | 99.0 /100 | #70 | Exceptional 9.9% |
| Celtics | 98.9 /100 | #71 | Exceptional 9.9% |
| Bolivians | 98.9 /100 | #72 | Exceptional 9.9% |
| Kenyans | 98.7 /100 | #73 | Exceptional 9.9% |
| Immigrants | Laos | 98.7 /100 | #74 | Exceptional 9.9% |
| Immigrants | Australia | 98.6 /100 | #75 | Exceptional 9.9% |
| Czechoslovakians | 98.4 /100 | #76 | Exceptional 9.9% |
| Chickasaw | 98.4 /100 | #77 | Exceptional 9.9% |
| Assyrians/Chaldeans/Syriacs | 98.3 /100 | #78 | Exceptional 9.9% |
| Icelanders | 98.3 /100 | #79 | Exceptional 9.9% |
| Immigrants | Netherlands | 98.2 /100 | #80 | Exceptional 9.9% |
| Yaqui | 98.0 /100 | #81 | Exceptional 9.9% |
| Sri Lankans | 98.0 /100 | #82 | Exceptional 9.9% |
Demographics Similar to Immigrants from Uzbekistan by Unemployment Among Ages 20 to 24 years
In terms of unemployment among ages 20 to 24 years, the demographic groups most similar to Immigrants from Uzbekistan are Nigerian (11.4%, a difference of 0.030%), Immigrants from Nigeria (11.5%, a difference of 0.64%), Cape Verdean (11.5%, a difference of 0.72%), Senegalese (11.5%, a difference of 1.1%), and Delaware (11.3%, a difference of 1.1%).
| Demographics | Rating | Rank | Unemployment Among Ages 20 to 24 years |
| Sub-Saharan Africans | 0.0 /100 | #264 | Tragic 11.1% |
| Immigrants | Ireland | 0.0 /100 | #265 | Tragic 11.1% |
| Immigrants | Liberia | 0.0 /100 | #266 | Tragic 11.1% |
| Immigrants | Greece | 0.0 /100 | #267 | Tragic 11.1% |
| Maltese | 0.0 /100 | #268 | Tragic 11.2% |
| Ute | 0.0 /100 | #269 | Tragic 11.2% |
| Delaware | 0.0 /100 | #270 | Tragic 11.3% |
| Immigrants | Uzbekistan | 0.0 /100 | #271 | Tragic 11.4% |
| Nigerians | 0.0 /100 | #272 | Tragic 11.4% |
| Immigrants | Nigeria | 0.0 /100 | #273 | Tragic 11.5% |
| Cape Verdeans | 0.0 /100 | #274 | Tragic 11.5% |
| Senegalese | 0.0 /100 | #275 | Tragic 11.5% |
| Sierra Leoneans | 0.0 /100 | #276 | Tragic 11.5% |
| Africans | 0.0 /100 | #277 | Tragic 11.5% |
| Colville | 0.0 /100 | #278 | Tragic 11.6% |