Immigrants from Liberia vs U.S. Virgin Islander 8th Grade
COMPARE
Immigrants from Liberia
U.S. Virgin Islander
8th Grade
8th Grade Comparison
Immigrants from Liberia
U.S. Virgin Islanders
95.4%
8TH GRADE
8.9/ 100
METRIC RATING
215th/ 347
METRIC RANK
95.0%
8TH GRADE
0.9/ 100
METRIC RATING
253rd/ 347
METRIC RANK
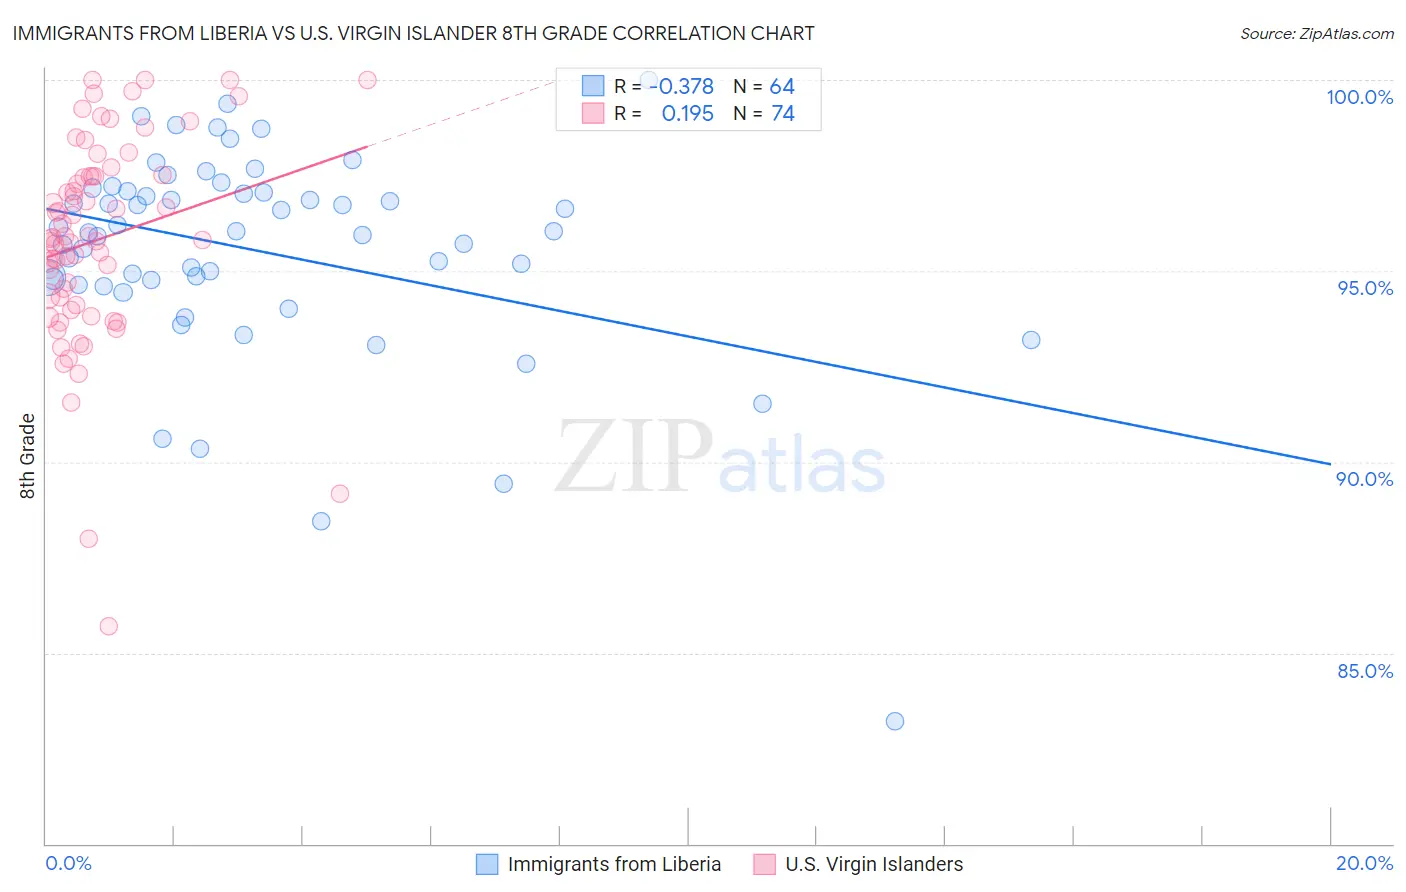
Immigrants from Liberia vs U.S. Virgin Islander 8th Grade Correlation Chart
The statistical analysis conducted on geographies consisting of 135,294,272 people shows a mild negative correlation between the proportion of Immigrants from Liberia and percentage of population with at least 8th grade education in the United States with a correlation coefficient (R) of -0.378 and weighted average of 95.4%. Similarly, the statistical analysis conducted on geographies consisting of 87,529,315 people shows a poor positive correlation between the proportion of U.S. Virgin Islanders and percentage of population with at least 8th grade education in the United States with a correlation coefficient (R) of 0.195 and weighted average of 95.0%, a difference of 0.38%.
8th Grade Correlation Summary
| Measurement | Immigrants from Liberia | U.S. Virgin Islander |
| Minimum | 83.2% | 85.7% |
| Maximum | 100.0% | 100.0% |
| Range | 16.8% | 14.3% |
| Mean | 95.5% | 95.8% |
| Median | 96.0% | 95.9% |
| Interquartile 25% (IQ1) | 94.7% | 94.1% |
| Interquartile 75% (IQ3) | 97.1% | 97.5% |
| Interquartile Range (IQR) | 2.4% | 3.4% |
| Standard Deviation (Sample) | 2.8% | 2.7% |
| Standard Deviation (Population) | 2.8% | 2.7% |
Similar Demographics by 8th Grade
Demographics Similar to Immigrants from Liberia by 8th Grade
In terms of 8th grade, the demographic groups most similar to Immigrants from Liberia are Laotian (95.4%, a difference of 0.0%), Immigrants from Chile (95.4%, a difference of 0.0%), Immigrants from Pakistan (95.4%, a difference of 0.010%), Samoan (95.4%, a difference of 0.010%), and Immigrants from Eastern Asia (95.4%, a difference of 0.010%).
| Demographics | Rating | Rank | 8th Grade |
| Portuguese | 14.3 /100 | #208 | Poor 95.5% |
| Immigrants | Lebanon | 13.7 /100 | #209 | Poor 95.4% |
| Africans | 13.6 /100 | #210 | Poor 95.4% |
| Immigrants | Morocco | 12.4 /100 | #211 | Poor 95.4% |
| Immigrants | Pakistan | 9.7 /100 | #212 | Tragic 95.4% |
| Laotians | 9.0 /100 | #213 | Tragic 95.4% |
| Immigrants | Chile | 9.0 /100 | #214 | Tragic 95.4% |
| Immigrants | Liberia | 8.9 /100 | #215 | Tragic 95.4% |
| Samoans | 8.4 /100 | #216 | Tragic 95.4% |
| Immigrants | Eastern Asia | 8.3 /100 | #217 | Tragic 95.4% |
| Dutch West Indians | 8.1 /100 | #218 | Tragic 95.4% |
| Spanish Americans | 8.0 /100 | #219 | Tragic 95.4% |
| Immigrants | Southern Europe | 7.7 /100 | #220 | Tragic 95.3% |
| Immigrants | Syria | 7.4 /100 | #221 | Tragic 95.3% |
| Immigrants | Malaysia | 7.3 /100 | #222 | Tragic 95.3% |
Demographics Similar to U.S. Virgin Islanders by 8th Grade
In terms of 8th grade, the demographic groups most similar to U.S. Virgin Islanders are Bolivian (95.0%, a difference of 0.010%), Immigrants from Ethiopia (95.0%, a difference of 0.010%), Korean (95.0%, a difference of 0.020%), Immigrants from Cameroon (95.0%, a difference of 0.020%), and Immigrants from China (95.0%, a difference of 0.030%).
| Demographics | Rating | Rank | 8th Grade |
| Somalis | 1.4 /100 | #246 | Tragic 95.1% |
| Immigrants | Senegal | 1.4 /100 | #247 | Tragic 95.1% |
| Uruguayans | 1.2 /100 | #248 | Tragic 95.1% |
| Immigrants | China | 1.1 /100 | #249 | Tragic 95.0% |
| Koreans | 1.1 /100 | #250 | Tragic 95.0% |
| Bolivians | 1.0 /100 | #251 | Tragic 95.0% |
| Immigrants | Ethiopia | 1.0 /100 | #252 | Tragic 95.0% |
| U.S. Virgin Islanders | 0.9 /100 | #253 | Tragic 95.0% |
| Immigrants | Cameroon | 0.8 /100 | #254 | Tragic 95.0% |
| Immigrants | Somalia | 0.7 /100 | #255 | Tragic 95.0% |
| Colombians | 0.7 /100 | #256 | Tragic 95.0% |
| Afghans | 0.6 /100 | #257 | Tragic 94.9% |
| Immigrants | Congo | 0.6 /100 | #258 | Tragic 94.9% |
| Ghanaians | 0.6 /100 | #259 | Tragic 94.9% |
| Immigrants | Jamaica | 0.6 /100 | #260 | Tragic 94.9% |