Japanese vs Immigrants from Liberia 8th Grade
COMPARE
Japanese
Immigrants from Liberia
8th Grade
8th Grade Comparison
Japanese
Immigrants from Liberia
93.6%
8TH GRADE
0.0/ 100
METRIC RATING
310th/ 347
METRIC RANK
95.4%
8TH GRADE
8.9/ 100
METRIC RATING
215th/ 347
METRIC RANK
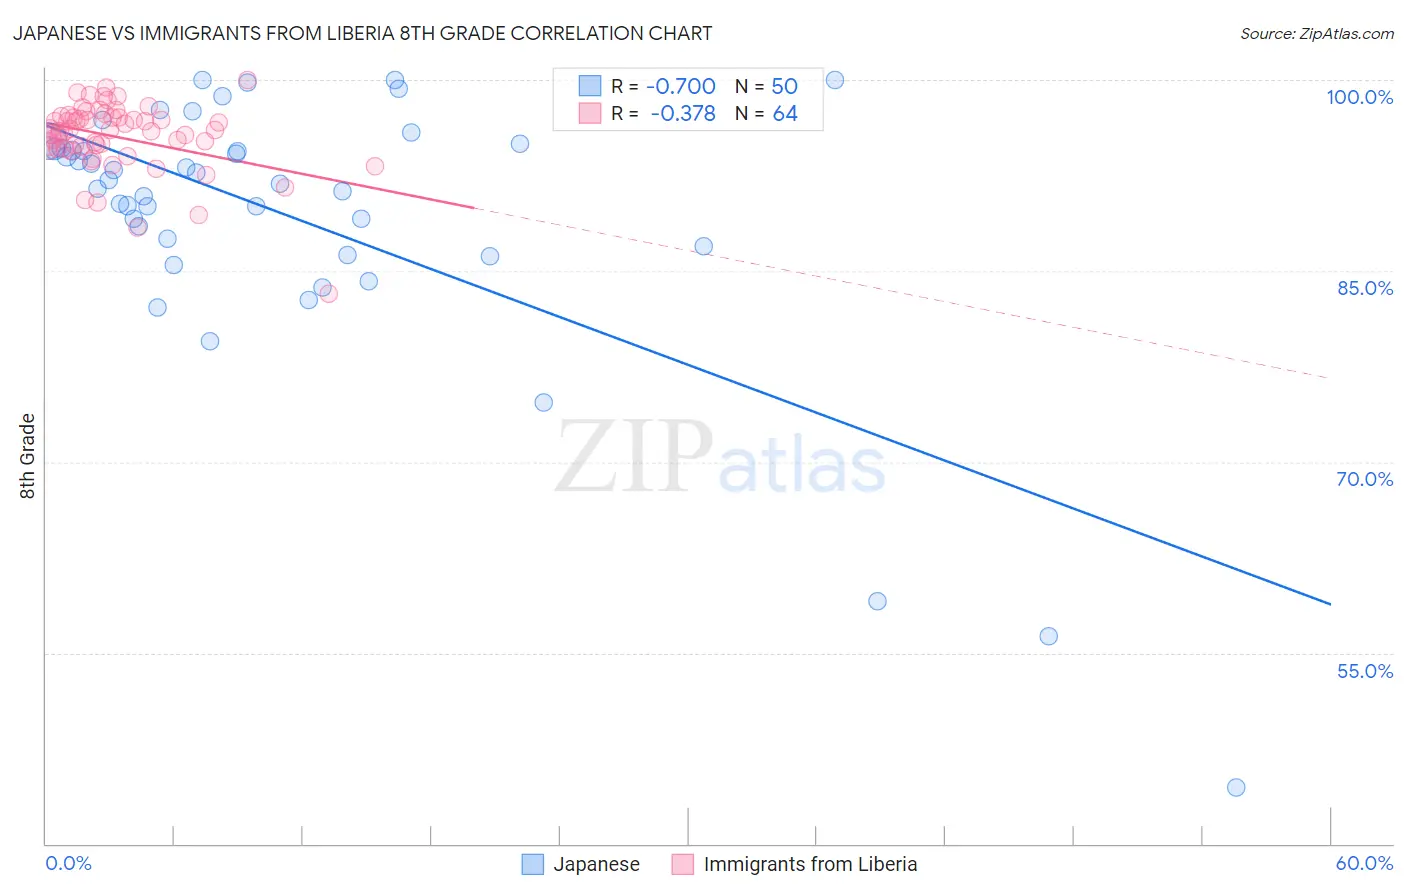
Japanese vs Immigrants from Liberia 8th Grade Correlation Chart
The statistical analysis conducted on geographies consisting of 249,183,224 people shows a strong negative correlation between the proportion of Japanese and percentage of population with at least 8th grade education in the United States with a correlation coefficient (R) of -0.700 and weighted average of 93.6%. Similarly, the statistical analysis conducted on geographies consisting of 135,294,272 people shows a mild negative correlation between the proportion of Immigrants from Liberia and percentage of population with at least 8th grade education in the United States with a correlation coefficient (R) of -0.378 and weighted average of 95.4%, a difference of 1.9%.
8th Grade Correlation Summary
| Measurement | Japanese | Immigrants from Liberia |
| Minimum | 44.4% | 83.2% |
| Maximum | 100.0% | 100.0% |
| Range | 55.6% | 16.8% |
| Mean | 89.3% | 95.5% |
| Median | 92.0% | 96.0% |
| Interquartile 25% (IQ1) | 86.9% | 94.7% |
| Interquartile 75% (IQ3) | 94.6% | 97.1% |
| Interquartile Range (IQR) | 7.8% | 2.4% |
| Standard Deviation (Sample) | 10.8% | 2.8% |
| Standard Deviation (Population) | 10.7% | 2.8% |
Similar Demographics by 8th Grade
Demographics Similar to Japanese by 8th Grade
In terms of 8th grade, the demographic groups most similar to Japanese are Immigrants (93.6%, a difference of 0.0%), Immigrants from Bangladesh (93.6%, a difference of 0.0%), Ecuadorian (93.6%, a difference of 0.030%), Cape Verdean (93.5%, a difference of 0.040%), and Immigrants from Caribbean (93.5%, a difference of 0.070%).
| Demographics | Rating | Rank | 8th Grade |
| Immigrants | Dominica | 0.0 /100 | #303 | Tragic 94.0% |
| Guyanese | 0.0 /100 | #304 | Tragic 93.9% |
| Immigrants | Haiti | 0.0 /100 | #305 | Tragic 93.9% |
| Immigrants | Guyana | 0.0 /100 | #306 | Tragic 93.8% |
| Immigrants | Portugal | 0.0 /100 | #307 | Tragic 93.8% |
| Ecuadorians | 0.0 /100 | #308 | Tragic 93.6% |
| Immigrants | Immigrants | 0.0 /100 | #309 | Tragic 93.6% |
| Japanese | 0.0 /100 | #310 | Tragic 93.6% |
| Immigrants | Bangladesh | 0.0 /100 | #311 | Tragic 93.6% |
| Cape Verdeans | 0.0 /100 | #312 | Tragic 93.5% |
| Immigrants | Caribbean | 0.0 /100 | #313 | Tragic 93.5% |
| Immigrants | Vietnam | 0.0 /100 | #314 | Tragic 93.5% |
| Vietnamese | 0.0 /100 | #315 | Tragic 93.5% |
| Immigrants | Cambodia | 0.0 /100 | #316 | Tragic 93.3% |
| Immigrants | Ecuador | 0.0 /100 | #317 | Tragic 93.3% |
Demographics Similar to Immigrants from Liberia by 8th Grade
In terms of 8th grade, the demographic groups most similar to Immigrants from Liberia are Laotian (95.4%, a difference of 0.0%), Immigrants from Chile (95.4%, a difference of 0.0%), Immigrants from Pakistan (95.4%, a difference of 0.010%), Samoan (95.4%, a difference of 0.010%), and Immigrants from Eastern Asia (95.4%, a difference of 0.010%).
| Demographics | Rating | Rank | 8th Grade |
| Portuguese | 14.3 /100 | #208 | Poor 95.5% |
| Immigrants | Lebanon | 13.7 /100 | #209 | Poor 95.4% |
| Africans | 13.6 /100 | #210 | Poor 95.4% |
| Immigrants | Morocco | 12.4 /100 | #211 | Poor 95.4% |
| Immigrants | Pakistan | 9.7 /100 | #212 | Tragic 95.4% |
| Laotians | 9.0 /100 | #213 | Tragic 95.4% |
| Immigrants | Chile | 9.0 /100 | #214 | Tragic 95.4% |
| Immigrants | Liberia | 8.9 /100 | #215 | Tragic 95.4% |
| Samoans | 8.4 /100 | #216 | Tragic 95.4% |
| Immigrants | Eastern Asia | 8.3 /100 | #217 | Tragic 95.4% |
| Dutch West Indians | 8.1 /100 | #218 | Tragic 95.4% |
| Spanish Americans | 8.0 /100 | #219 | Tragic 95.4% |
| Immigrants | Southern Europe | 7.7 /100 | #220 | Tragic 95.3% |
| Immigrants | Syria | 7.4 /100 | #221 | Tragic 95.3% |
| Immigrants | Malaysia | 7.3 /100 | #222 | Tragic 95.3% |