Immigrants from Argentina vs Immigrants from Albania High School Diploma
COMPARE
Immigrants from Argentina
Immigrants from Albania
High School Diploma
High School Diploma Comparison
Immigrants from Argentina
Immigrants from Albania
89.4%
HIGH SCHOOL DIPLOMA
65.5/ 100
METRIC RATING
156th/ 347
METRIC RANK
89.3%
HIGH SCHOOL DIPLOMA
59.4/ 100
METRIC RATING
166th/ 347
METRIC RANK
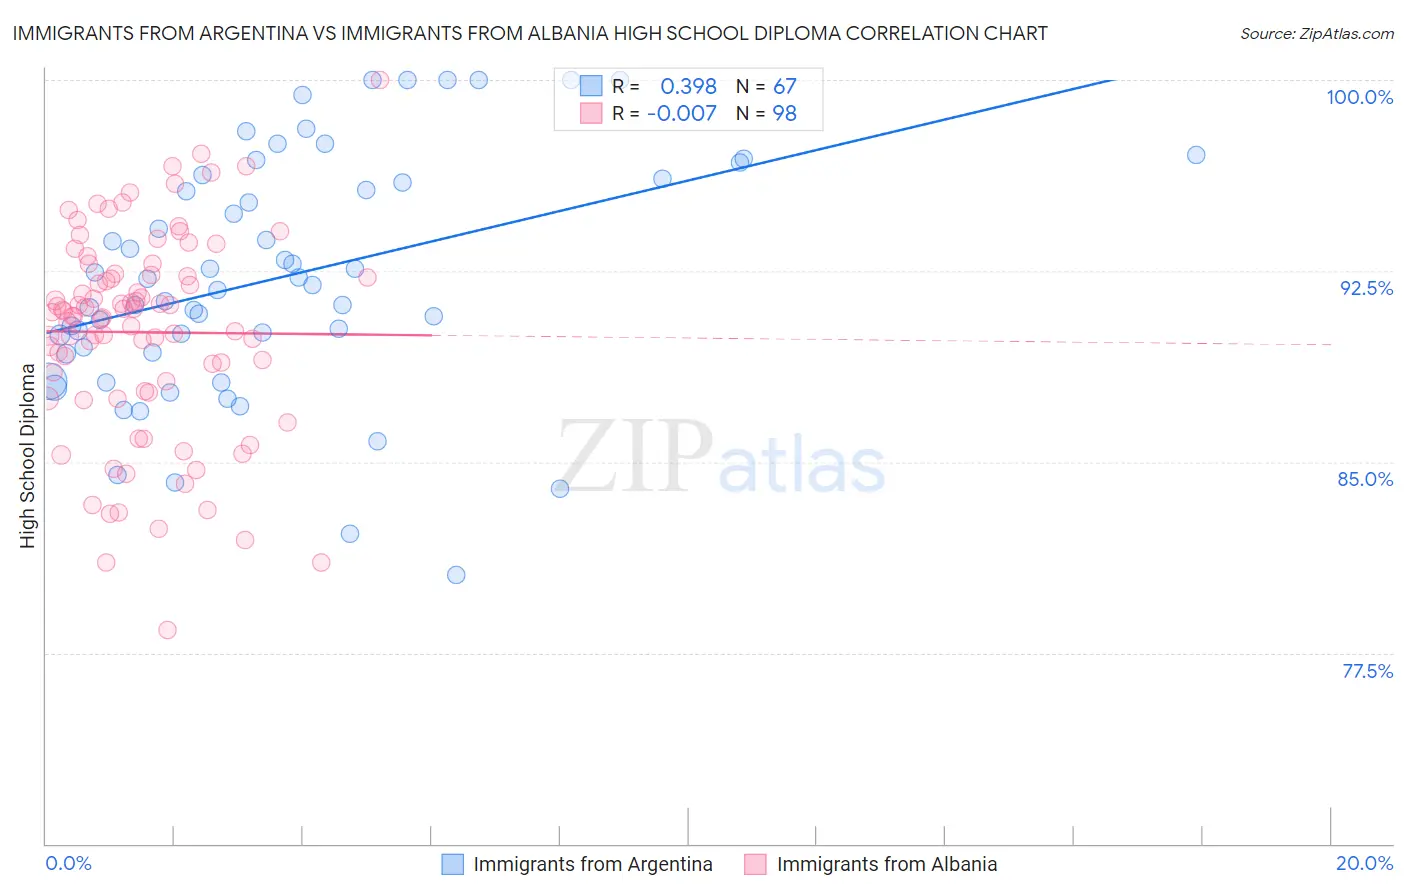
Immigrants from Argentina vs Immigrants from Albania High School Diploma Correlation Chart
The statistical analysis conducted on geographies consisting of 264,434,241 people shows a mild positive correlation between the proportion of Immigrants from Argentina and percentage of population with at least high school diploma education in the United States with a correlation coefficient (R) of 0.398 and weighted average of 89.4%. Similarly, the statistical analysis conducted on geographies consisting of 119,309,649 people shows no correlation between the proportion of Immigrants from Albania and percentage of population with at least high school diploma education in the United States with a correlation coefficient (R) of -0.007 and weighted average of 89.3%, a difference of 0.10%.
High School Diploma Correlation Summary
| Measurement | Immigrants from Argentina | Immigrants from Albania |
| Minimum | 80.6% | 78.4% |
| Maximum | 100.0% | 100.0% |
| Range | 19.4% | 21.6% |
| Mean | 92.2% | 90.1% |
| Median | 91.9% | 90.8% |
| Interquartile 25% (IQ1) | 89.3% | 87.8% |
| Interquartile 75% (IQ3) | 96.1% | 92.4% |
| Interquartile Range (IQR) | 6.8% | 4.6% |
| Standard Deviation (Sample) | 4.7% | 4.0% |
| Standard Deviation (Population) | 4.6% | 4.0% |
Demographics Similar to Immigrants from Argentina and Immigrants from Albania by High School Diploma
In terms of high school diploma, the demographic groups most similar to Immigrants from Argentina are Alsatian (89.4%, a difference of 0.020%), Immigrants from Northern Africa (89.4%, a difference of 0.020%), Immigrants from Malaysia (89.3%, a difference of 0.030%), Immigrants from Iraq (89.4%, a difference of 0.050%), and Immigrants from Pakistan (89.3%, a difference of 0.050%). Similarly, the demographic groups most similar to Immigrants from Albania are Immigrants from Asia (89.3%, a difference of 0.010%), Immigrants from Hong Kong (89.3%, a difference of 0.010%), Brazilian (89.3%, a difference of 0.030%), Bermudan (89.3%, a difference of 0.030%), and Cree (89.3%, a difference of 0.030%).
| Demographics | Rating | Rank | High School Diploma |
| Paraguayans | 71.4 /100 | #151 | Good 89.5% |
| Asians | 70.7 /100 | #152 | Good 89.4% |
| Immigrants | Iraq | 68.7 /100 | #153 | Good 89.4% |
| Alsatians | 66.8 /100 | #154 | Good 89.4% |
| Immigrants | Northern Africa | 66.4 /100 | #155 | Good 89.4% |
| Immigrants | Argentina | 65.5 /100 | #156 | Good 89.4% |
| Immigrants | Malaysia | 63.5 /100 | #157 | Good 89.3% |
| Immigrants | Pakistan | 62.5 /100 | #158 | Good 89.3% |
| Immigrants | China | 62.0 /100 | #159 | Good 89.3% |
| Laotians | 61.8 /100 | #160 | Good 89.3% |
| Brazilians | 61.2 /100 | #161 | Good 89.3% |
| Bermudans | 61.1 /100 | #162 | Good 89.3% |
| Cree | 61.1 /100 | #163 | Good 89.3% |
| Immigrants | Nepal | 61.1 /100 | #164 | Good 89.3% |
| Immigrants | Asia | 59.8 /100 | #165 | Average 89.3% |
| Immigrants | Albania | 59.4 /100 | #166 | Average 89.3% |
| Immigrants | Hong Kong | 58.6 /100 | #167 | Average 89.3% |
| Delaware | 55.8 /100 | #168 | Average 89.2% |
| Iroquois | 55.1 /100 | #169 | Average 89.2% |
| Immigrants | Morocco | 53.3 /100 | #170 | Average 89.2% |
| Spanish | 52.9 /100 | #171 | Average 89.2% |