Immigrants from Albania vs Immigrants from Latvia College, Under 1 year
COMPARE
Immigrants from Albania
Immigrants from Latvia
College, Under 1 year
College, Under 1 year Comparison
Immigrants from Albania
Immigrants from Latvia
64.9%
COLLEGE, UNDER 1 YEAR
32.0/ 100
METRIC RATING
188th/ 347
METRIC RANK
70.1%
COLLEGE, UNDER 1 YEAR
99.9/ 100
METRIC RATING
46th/ 347
METRIC RANK
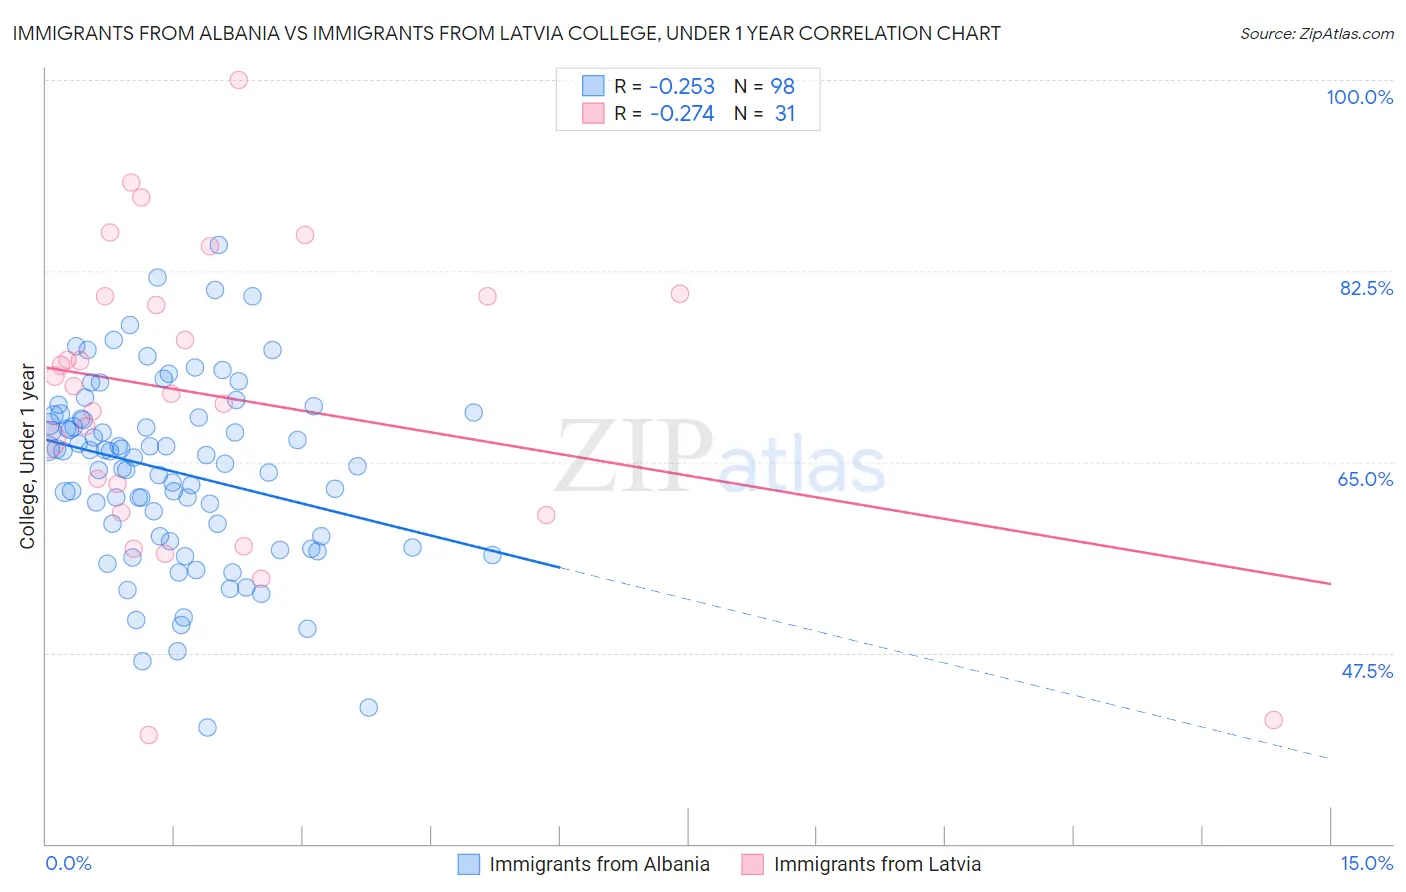
Immigrants from Albania vs Immigrants from Latvia College, Under 1 year Correlation Chart
The statistical analysis conducted on geographies consisting of 119,397,636 people shows a weak negative correlation between the proportion of Immigrants from Albania and percentage of population with at least college, under 1 year education in the United States with a correlation coefficient (R) of -0.253 and weighted average of 64.9%. Similarly, the statistical analysis conducted on geographies consisting of 113,735,345 people shows a weak negative correlation between the proportion of Immigrants from Latvia and percentage of population with at least college, under 1 year education in the United States with a correlation coefficient (R) of -0.274 and weighted average of 70.1%, a difference of 8.1%.
College, Under 1 year Correlation Summary
| Measurement | Immigrants from Albania | Immigrants from Latvia |
| Minimum | 40.7% | 40.0% |
| Maximum | 84.9% | 100.0% |
| Range | 44.2% | 60.0% |
| Mean | 64.1% | 71.0% |
| Median | 65.5% | 71.9% |
| Interquartile 25% (IQ1) | 58.2% | 60.4% |
| Interquartile 75% (IQ3) | 69.1% | 80.2% |
| Interquartile Range (IQR) | 10.9% | 19.8% |
| Standard Deviation (Sample) | 8.4% | 13.7% |
| Standard Deviation (Population) | 8.4% | 13.5% |
Similar Demographics by College, Under 1 year
Demographics Similar to Immigrants from Albania by College, Under 1 year
In terms of college, under 1 year, the demographic groups most similar to Immigrants from Albania are Spanish (64.9%, a difference of 0.020%), Immigrants from Philippines (64.8%, a difference of 0.10%), Immigrants from Southern Europe (64.9%, a difference of 0.11%), Immigrants from Armenia (64.7%, a difference of 0.21%), and Immigrants from Thailand (64.7%, a difference of 0.27%).
| Demographics | Rating | Rank | College, Under 1 year |
| Spaniards | 45.5 /100 | #181 | Average 65.3% |
| Immigrants | Africa | 44.7 /100 | #182 | Average 65.3% |
| Immigrants | Poland | 42.6 /100 | #183 | Average 65.2% |
| Bermudans | 42.0 /100 | #184 | Average 65.2% |
| Sri Lankans | 41.7 /100 | #185 | Average 65.2% |
| Immigrants | Sierra Leone | 39.7 /100 | #186 | Fair 65.1% |
| Immigrants | Southern Europe | 34.3 /100 | #187 | Fair 64.9% |
| Immigrants | Albania | 32.0 /100 | #188 | Fair 64.9% |
| Spanish | 31.6 /100 | #189 | Fair 64.9% |
| Immigrants | Philippines | 30.1 /100 | #190 | Fair 64.8% |
| Immigrants | Armenia | 28.1 /100 | #191 | Fair 64.7% |
| Immigrants | Thailand | 27.0 /100 | #192 | Fair 64.7% |
| Slovaks | 26.7 /100 | #193 | Fair 64.7% |
| Immigrants | Cameroon | 24.6 /100 | #194 | Fair 64.6% |
| Immigrants | South Eastern Asia | 22.1 /100 | #195 | Fair 64.5% |
Demographics Similar to Immigrants from Latvia by College, Under 1 year
In terms of college, under 1 year, the demographic groups most similar to Immigrants from Latvia are Immigrants from Bulgaria (70.0%, a difference of 0.11%), Immigrants from Norway (70.2%, a difference of 0.12%), Israeli (70.2%, a difference of 0.14%), New Zealander (70.2%, a difference of 0.14%), and Immigrants from Netherlands (70.0%, a difference of 0.17%).
| Demographics | Rating | Rank | College, Under 1 year |
| Bhutanese | 99.9 /100 | #39 | Exceptional 70.3% |
| Immigrants | Turkey | 99.9 /100 | #40 | Exceptional 70.3% |
| Immigrants | Kuwait | 99.9 /100 | #41 | Exceptional 70.3% |
| Immigrants | Lithuania | 99.9 /100 | #42 | Exceptional 70.3% |
| Israelis | 99.9 /100 | #43 | Exceptional 70.2% |
| New Zealanders | 99.9 /100 | #44 | Exceptional 70.2% |
| Immigrants | Norway | 99.9 /100 | #45 | Exceptional 70.2% |
| Immigrants | Latvia | 99.9 /100 | #46 | Exceptional 70.1% |
| Immigrants | Bulgaria | 99.8 /100 | #47 | Exceptional 70.0% |
| Immigrants | Netherlands | 99.8 /100 | #48 | Exceptional 70.0% |
| Immigrants | Austria | 99.8 /100 | #49 | Exceptional 70.0% |
| Zimbabweans | 99.8 /100 | #50 | Exceptional 69.9% |
| Mongolians | 99.8 /100 | #51 | Exceptional 69.9% |
| Immigrants | Russia | 99.8 /100 | #52 | Exceptional 69.9% |
| South Africans | 99.7 /100 | #53 | Exceptional 69.7% |