Filipino vs Cherokee College, 1 year or more
COMPARE
Filipino
Cherokee
College, 1 year or more
College, 1 year or more Comparison
Filipinos
Cherokee
71.0%
COLLEGE, 1 YEAR OR MORE
100.0/ 100
METRIC RATING
1st/ 347
METRIC RANK
53.2%
COLLEGE, 1 YEAR OR MORE
0.0/ 100
METRIC RATING
294th/ 347
METRIC RANK
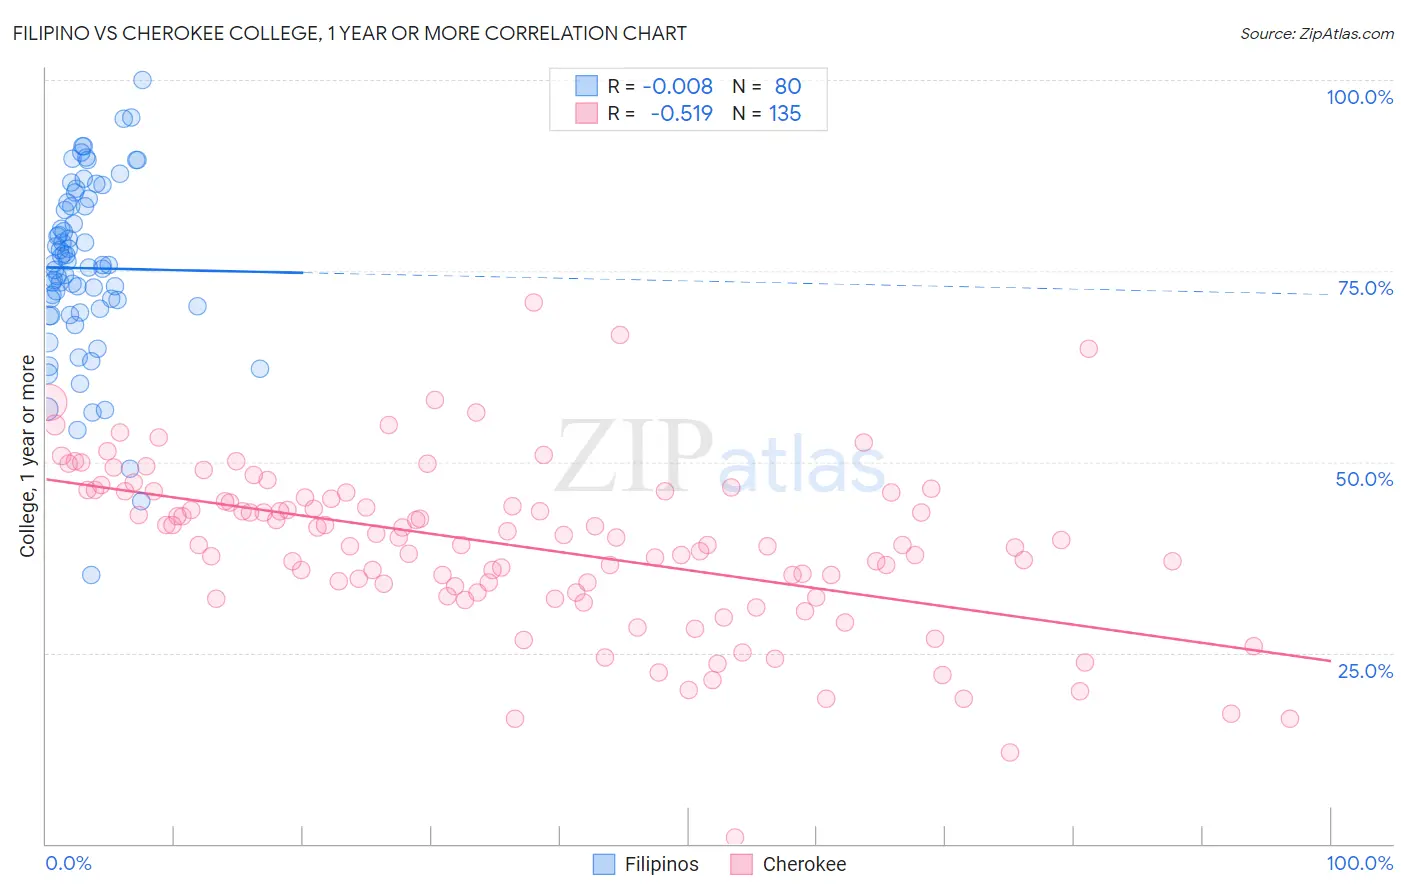
Filipino vs Cherokee College, 1 year or more Correlation Chart
The statistical analysis conducted on geographies consisting of 254,347,704 people shows no correlation between the proportion of Filipinos and percentage of population with at least college, 1 year or more education in the United States with a correlation coefficient (R) of -0.008 and weighted average of 71.0%. Similarly, the statistical analysis conducted on geographies consisting of 493,716,621 people shows a substantial negative correlation between the proportion of Cherokee and percentage of population with at least college, 1 year or more education in the United States with a correlation coefficient (R) of -0.519 and weighted average of 53.2%, a difference of 33.5%.
College, 1 year or more Correlation Summary
| Measurement | Filipino | Cherokee |
| Minimum | 35.1% | 0.80% |
| Maximum | 100.0% | 70.9% |
| Range | 64.9% | 70.1% |
| Mean | 75.4% | 39.0% |
| Median | 75.7% | 39.7% |
| Interquartile 25% (IQ1) | 69.8% | 33.0% |
| Interquartile 75% (IQ3) | 83.8% | 46.0% |
| Interquartile Range (IQR) | 13.9% | 13.1% |
| Standard Deviation (Sample) | 11.7% | 10.9% |
| Standard Deviation (Population) | 11.7% | 10.9% |
Similar Demographics by College, 1 year or more
Demographics Similar to Filipinos by College, 1 year or more
In terms of college, 1 year or more, the demographic groups most similar to Filipinos are Immigrants from Singapore (70.1%, a difference of 1.2%), Iranian (70.0%, a difference of 1.4%), Immigrants from Taiwan (69.6%, a difference of 1.9%), Immigrants from India (69.6%, a difference of 1.9%), and Immigrants from Iran (69.5%, a difference of 2.1%).
| Demographics | Rating | Rank | College, 1 year or more |
| Filipinos | 100.0 /100 | #1 | Exceptional 71.0% |
| Immigrants | Singapore | 100.0 /100 | #2 | Exceptional 70.1% |
| Iranians | 100.0 /100 | #3 | Exceptional 70.0% |
| Immigrants | Taiwan | 100.0 /100 | #4 | Exceptional 69.6% |
| Immigrants | India | 100.0 /100 | #5 | Exceptional 69.6% |
| Immigrants | Iran | 100.0 /100 | #6 | Exceptional 69.5% |
| Okinawans | 100.0 /100 | #7 | Exceptional 69.0% |
| Thais | 100.0 /100 | #8 | Exceptional 68.6% |
| Immigrants | Israel | 100.0 /100 | #9 | Exceptional 67.8% |
| Immigrants | Australia | 100.0 /100 | #10 | Exceptional 67.7% |
| Immigrants | South Central Asia | 100.0 /100 | #11 | Exceptional 67.1% |
| Cypriots | 100.0 /100 | #12 | Exceptional 67.0% |
| Immigrants | Sweden | 100.0 /100 | #13 | Exceptional 66.8% |
| Burmese | 100.0 /100 | #14 | Exceptional 66.7% |
| Cambodians | 100.0 /100 | #15 | Exceptional 66.7% |
Demographics Similar to Cherokee by College, 1 year or more
In terms of college, 1 year or more, the demographic groups most similar to Cherokee are Yaqui (53.2%, a difference of 0.010%), Black/African American (53.3%, a difference of 0.21%), Chickasaw (53.3%, a difference of 0.23%), Sioux (53.0%, a difference of 0.35%), and Cuban (53.4%, a difference of 0.36%).
| Demographics | Rating | Rank | College, 1 year or more |
| Immigrants | Belize | 0.1 /100 | #287 | Tragic 53.5% |
| Alaska Natives | 0.0 /100 | #288 | Tragic 53.4% |
| Immigrants | Ecuador | 0.0 /100 | #289 | Tragic 53.4% |
| Alaskan Athabascans | 0.0 /100 | #290 | Tragic 53.4% |
| Cubans | 0.0 /100 | #291 | Tragic 53.4% |
| Chickasaw | 0.0 /100 | #292 | Tragic 53.3% |
| Blacks/African Americans | 0.0 /100 | #293 | Tragic 53.3% |
| Cherokee | 0.0 /100 | #294 | Tragic 53.2% |
| Yaqui | 0.0 /100 | #295 | Tragic 53.2% |
| Sioux | 0.0 /100 | #296 | Tragic 53.0% |
| Paiute | 0.0 /100 | #297 | Tragic 52.9% |
| Immigrants | Dominica | 0.0 /100 | #298 | Tragic 52.5% |
| Immigrants | Nicaragua | 0.0 /100 | #299 | Tragic 52.4% |
| Choctaw | 0.0 /100 | #300 | Tragic 52.3% |
| Haitians | 0.0 /100 | #301 | Tragic 52.3% |