English vs Immigrants from Eastern Europe 4th Grade
COMPARE
English
Immigrants from Eastern Europe
4th Grade
4th Grade Comparison
English
Immigrants from Eastern Europe
98.4%
4TH GRADE
100.0/ 100
METRIC RATING
11th/ 347
METRIC RANK
97.6%
4TH GRADE
71.3/ 100
METRIC RATING
153rd/ 347
METRIC RANK
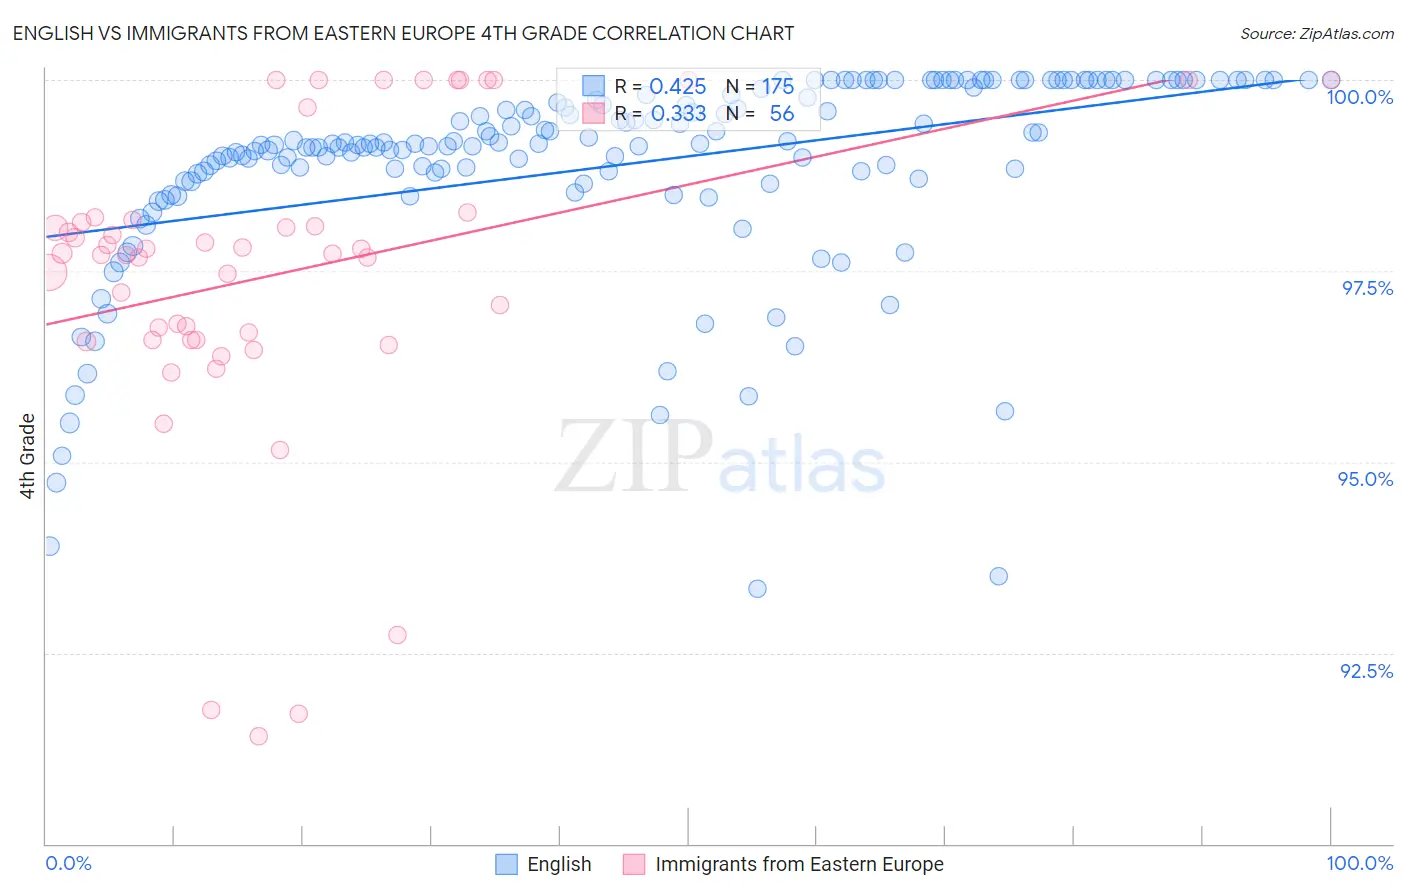
English vs Immigrants from Eastern Europe 4th Grade Correlation Chart
The statistical analysis conducted on geographies consisting of 579,981,272 people shows a moderate positive correlation between the proportion of English and percentage of population with at least 4th grade education in the United States with a correlation coefficient (R) of 0.425 and weighted average of 98.4%. Similarly, the statistical analysis conducted on geographies consisting of 475,879,420 people shows a mild positive correlation between the proportion of Immigrants from Eastern Europe and percentage of population with at least 4th grade education in the United States with a correlation coefficient (R) of 0.333 and weighted average of 97.6%, a difference of 0.83%.
4th Grade Correlation Summary
| Measurement | English | Immigrants from Eastern Europe |
| Minimum | 93.3% | 91.4% |
| Maximum | 100.0% | 100.0% |
| Range | 6.7% | 8.6% |
| Mean | 98.9% | 97.5% |
| Median | 99.2% | 97.7% |
| Interquartile 25% (IQ1) | 98.7% | 96.6% |
| Interquartile 75% (IQ3) | 99.9% | 98.2% |
| Interquartile Range (IQR) | 1.2% | 1.6% |
| Standard Deviation (Sample) | 1.3% | 2.0% |
| Standard Deviation (Population) | 1.3% | 2.0% |
Similar Demographics by 4th Grade
Demographics Similar to English by 4th Grade
In terms of 4th grade, the demographic groups most similar to English are Tlingit-Haida (98.4%, a difference of 0.0%), Swedish (98.4%, a difference of 0.0%), Alaskan Athabascan (98.4%, a difference of 0.010%), Carpatho Rusyn (98.4%, a difference of 0.010%), and Slovene (98.4%, a difference of 0.030%).
| Demographics | Rating | Rank | 4th Grade |
| Inupiat | 100.0 /100 | #4 | Exceptional 98.6% |
| Yup'ik | 100.0 /100 | #5 | Exceptional 98.5% |
| Norwegians | 100.0 /100 | #6 | Exceptional 98.5% |
| Slovaks | 100.0 /100 | #7 | Exceptional 98.5% |
| Germans | 100.0 /100 | #8 | Exceptional 98.5% |
| Slovenes | 100.0 /100 | #9 | Exceptional 98.4% |
| Alaskan Athabascans | 100.0 /100 | #10 | Exceptional 98.4% |
| English | 100.0 /100 | #11 | Exceptional 98.4% |
| Tlingit-Haida | 100.0 /100 | #12 | Exceptional 98.4% |
| Swedes | 100.0 /100 | #13 | Exceptional 98.4% |
| Carpatho Rusyns | 100.0 /100 | #14 | Exceptional 98.4% |
| Dutch | 100.0 /100 | #15 | Exceptional 98.4% |
| Scottish | 100.0 /100 | #16 | Exceptional 98.4% |
| Pennsylvania Germans | 100.0 /100 | #17 | Exceptional 98.4% |
| Poles | 100.0 /100 | #18 | Exceptional 98.4% |
Demographics Similar to Immigrants from Eastern Europe by 4th Grade
In terms of 4th grade, the demographic groups most similar to Immigrants from Eastern Europe are Immigrants from South Central Asia (97.6%, a difference of 0.020%), Immigrants from Russia (97.6%, a difference of 0.020%), Albanian (97.6%, a difference of 0.020%), Immigrants from Jordan (97.6%, a difference of 0.020%), and Immigrants from Bosnia and Herzegovina (97.6%, a difference of 0.020%).
| Demographics | Rating | Rank | 4th Grade |
| Jordanians | 81.3 /100 | #146 | Excellent 97.7% |
| Ute | 80.6 /100 | #147 | Excellent 97.7% |
| Hopi | 80.6 /100 | #148 | Excellent 97.7% |
| Soviet Union | 77.8 /100 | #149 | Good 97.6% |
| Immigrants | Israel | 77.7 /100 | #150 | Good 97.6% |
| Alsatians | 77.2 /100 | #151 | Good 97.6% |
| Immigrants | South Central Asia | 76.2 /100 | #152 | Good 97.6% |
| Immigrants | Eastern Europe | 71.3 /100 | #153 | Good 97.6% |
| Immigrants | Russia | 67.0 /100 | #154 | Good 97.6% |
| Albanians | 67.0 /100 | #155 | Good 97.6% |
| Immigrants | Jordan | 66.9 /100 | #156 | Good 97.6% |
| Immigrants | Bosnia and Herzegovina | 66.0 /100 | #157 | Good 97.6% |
| French American Indians | 65.9 /100 | #158 | Good 97.6% |
| Immigrants | Italy | 63.7 /100 | #159 | Good 97.6% |
| Apache | 61.3 /100 | #160 | Good 97.6% |