Immigrants from Afghanistan vs Norwegian High School Diploma
COMPARE
Immigrants from Afghanistan
Norwegian
High School Diploma
High School Diploma Comparison
Immigrants from Afghanistan
Norwegians
88.3%
HIGH SCHOOL DIPLOMA
8.6/ 100
METRIC RATING
221st/ 347
METRIC RANK
92.5%
HIGH SCHOOL DIPLOMA
100.0/ 100
METRIC RATING
1st/ 347
METRIC RANK
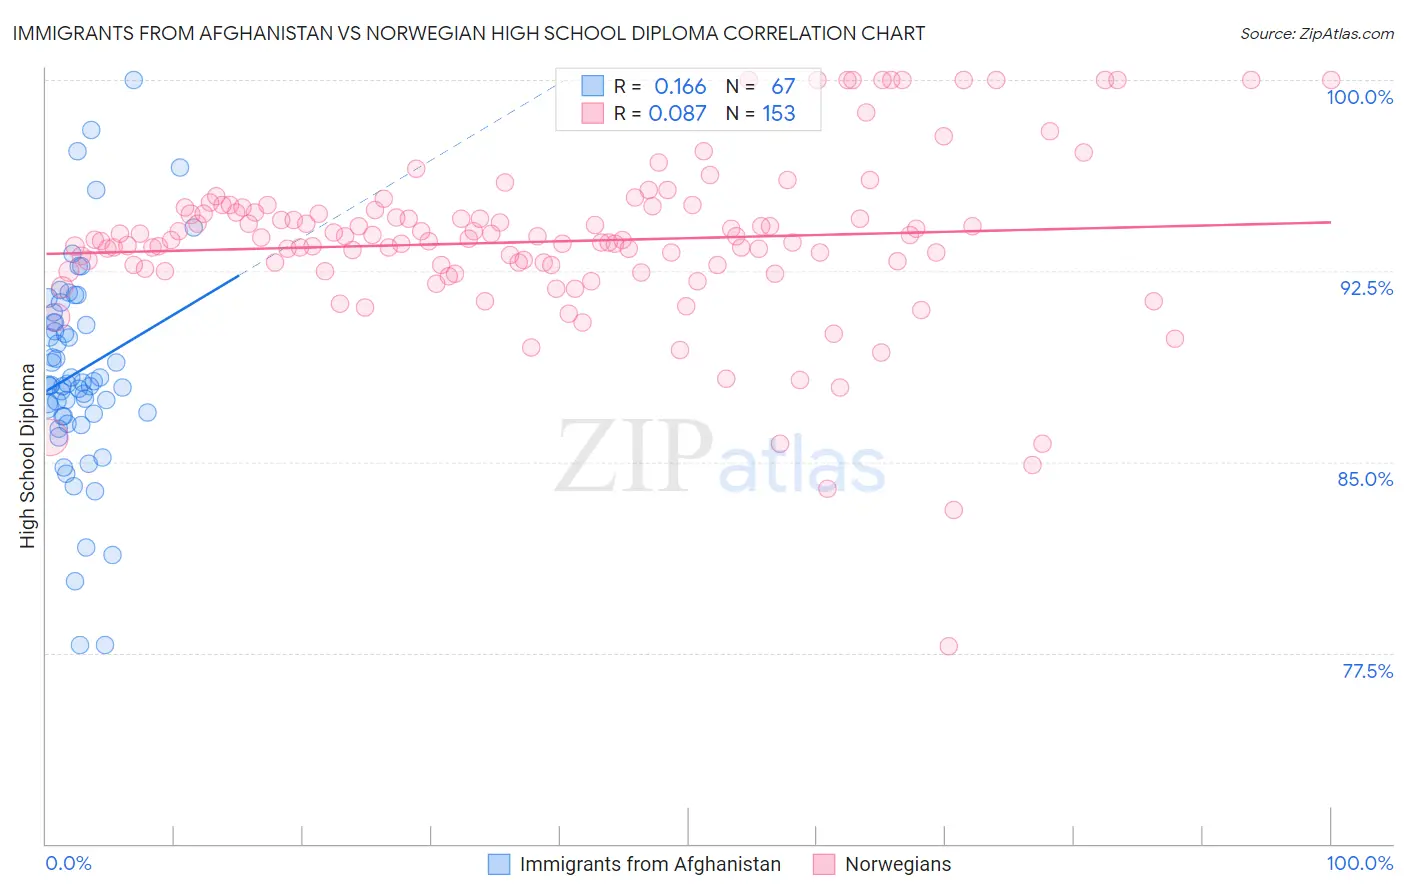
Immigrants from Afghanistan vs Norwegian High School Diploma Correlation Chart
The statistical analysis conducted on geographies consisting of 147,629,579 people shows a poor positive correlation between the proportion of Immigrants from Afghanistan and percentage of population with at least high school diploma education in the United States with a correlation coefficient (R) of 0.166 and weighted average of 88.3%. Similarly, the statistical analysis conducted on geographies consisting of 533,395,571 people shows a slight positive correlation between the proportion of Norwegians and percentage of population with at least high school diploma education in the United States with a correlation coefficient (R) of 0.087 and weighted average of 92.5%, a difference of 4.7%.
High School Diploma Correlation Summary
| Measurement | Immigrants from Afghanistan | Norwegian |
| Minimum | 77.8% | 77.8% |
| Maximum | 100.0% | 100.0% |
| Range | 22.2% | 22.2% |
| Mean | 88.5% | 93.7% |
| Median | 88.0% | 93.7% |
| Interquartile 25% (IQ1) | 86.8% | 92.7% |
| Interquartile 75% (IQ3) | 90.5% | 94.9% |
| Interquartile Range (IQR) | 3.7% | 2.2% |
| Standard Deviation (Sample) | 4.1% | 3.3% |
| Standard Deviation (Population) | 4.1% | 3.3% |
Similar Demographics by High School Diploma
Demographics Similar to Immigrants from Afghanistan by High School Diploma
In terms of high school diploma, the demographic groups most similar to Immigrants from Afghanistan are Tongan (88.4%, a difference of 0.040%), Colville (88.3%, a difference of 0.040%), Costa Rican (88.4%, a difference of 0.050%), Immigrants from Zaire (88.3%, a difference of 0.050%), and Immigrants from Bolivia (88.4%, a difference of 0.070%).
| Demographics | Rating | Rank | High School Diploma |
| Immigrants | Cameroon | 10.9 /100 | #214 | Poor 88.4% |
| Crow | 10.9 /100 | #215 | Poor 88.4% |
| Chickasaw | 10.7 /100 | #216 | Poor 88.4% |
| Immigrants | Africa | 10.6 /100 | #217 | Poor 88.4% |
| Immigrants | Bolivia | 10.3 /100 | #218 | Poor 88.4% |
| Costa Ricans | 9.6 /100 | #219 | Tragic 88.4% |
| Tongans | 9.5 /100 | #220 | Tragic 88.4% |
| Immigrants | Afghanistan | 8.6 /100 | #221 | Tragic 88.3% |
| Colville | 7.8 /100 | #222 | Tragic 88.3% |
| Immigrants | Zaire | 7.6 /100 | #223 | Tragic 88.3% |
| Shoshone | 7.0 /100 | #224 | Tragic 88.3% |
| Creek | 6.9 /100 | #225 | Tragic 88.3% |
| Uruguayans | 5.6 /100 | #226 | Tragic 88.2% |
| Immigrants | Liberia | 5.5 /100 | #227 | Tragic 88.2% |
| Kiowa | 5.3 /100 | #228 | Tragic 88.2% |
Demographics Similar to Norwegians by High School Diploma
In terms of high school diploma, the demographic groups most similar to Norwegians are Swedish (92.2%, a difference of 0.33%), Carpatho Rusyn (92.1%, a difference of 0.43%), Lithuanian (92.0%, a difference of 0.49%), Slovene (92.0%, a difference of 0.49%), and Slovak (92.0%, a difference of 0.51%).
| Demographics | Rating | Rank | High School Diploma |
| Norwegians | 100.0 /100 | #1 | Exceptional 92.5% |
| Swedes | 100.0 /100 | #2 | Exceptional 92.2% |
| Carpatho Rusyns | 100.0 /100 | #3 | Exceptional 92.1% |
| Lithuanians | 100.0 /100 | #4 | Exceptional 92.0% |
| Slovenes | 100.0 /100 | #5 | Exceptional 92.0% |
| Slovaks | 100.0 /100 | #6 | Exceptional 92.0% |
| Immigrants | India | 100.0 /100 | #7 | Exceptional 92.0% |
| Chinese | 100.0 /100 | #8 | Exceptional 92.0% |
| Latvians | 100.0 /100 | #9 | Exceptional 92.0% |
| Croatians | 100.0 /100 | #10 | Exceptional 92.0% |
| Eastern Europeans | 100.0 /100 | #11 | Exceptional 91.9% |
| Poles | 100.0 /100 | #12 | Exceptional 91.9% |
| Danes | 100.0 /100 | #13 | Exceptional 91.8% |
| Bulgarians | 100.0 /100 | #14 | Exceptional 91.8% |
| Luxembourgers | 100.0 /100 | #15 | Exceptional 91.7% |