Immigrants from Afghanistan vs Colombian Unemployment Among Women with Children Ages 6 to 17 years
COMPARE
Immigrants from Afghanistan
Colombian
Unemployment Among Women with Children Ages 6 to 17 years
Unemployment Among Women with Children Ages 6 to 17 years Comparison
Immigrants from Afghanistan
Colombians
7.8%
UNEMPLOYMENT AMONG WOMEN WITH CHILDREN AGES 6 TO 17 YEARS
100.0/ 100
METRIC RATING
27th/ 347
METRIC RANK
9.3%
UNEMPLOYMENT AMONG WOMEN WITH CHILDREN AGES 6 TO 17 YEARS
2.2/ 100
METRIC RATING
241st/ 347
METRIC RANK
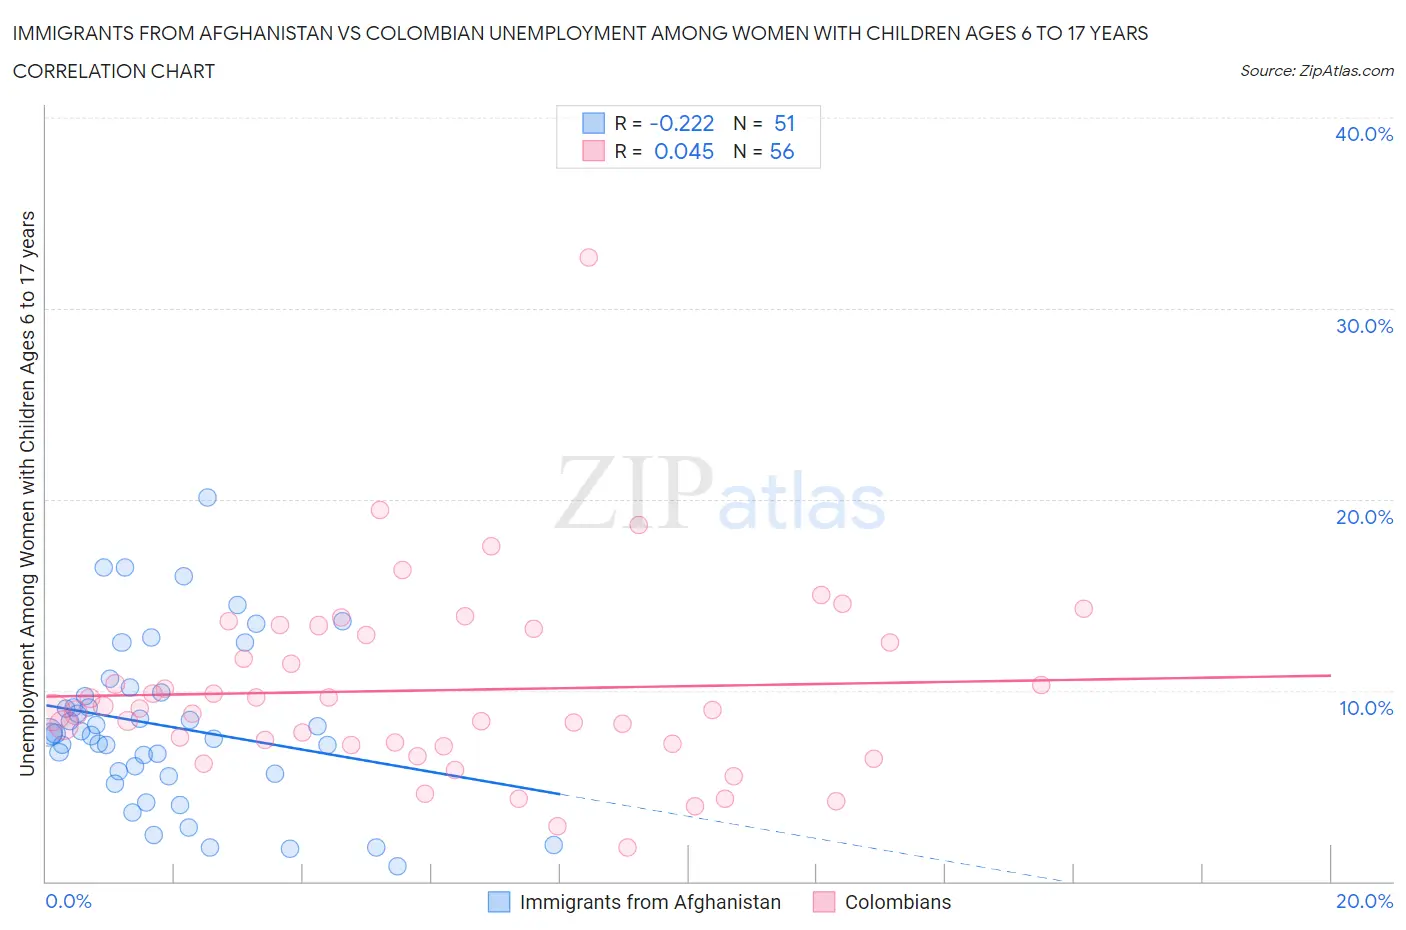
Immigrants from Afghanistan vs Colombian Unemployment Among Women with Children Ages 6 to 17 years Correlation Chart
The statistical analysis conducted on geographies consisting of 127,539,801 people shows a weak negative correlation between the proportion of Immigrants from Afghanistan and unemployment rate among women with children between the ages 6 and 17 in the United States with a correlation coefficient (R) of -0.222 and weighted average of 7.8%. Similarly, the statistical analysis conducted on geographies consisting of 301,134,838 people shows no correlation between the proportion of Colombians and unemployment rate among women with children between the ages 6 and 17 in the United States with a correlation coefficient (R) of 0.045 and weighted average of 9.3%, a difference of 20.2%.
Unemployment Among Women with Children Ages 6 to 17 years Correlation Summary
| Measurement | Immigrants from Afghanistan | Colombian |
| Minimum | 0.80% | 1.8% |
| Maximum | 20.1% | 32.7% |
| Range | 19.3% | 30.9% |
| Mean | 8.1% | 10.0% |
| Median | 7.7% | 9.0% |
| Interquartile 25% (IQ1) | 5.6% | 7.2% |
| Interquartile 75% (IQ3) | 9.9% | 13.1% |
| Interquartile Range (IQR) | 4.3% | 5.9% |
| Standard Deviation (Sample) | 4.2% | 5.0% |
| Standard Deviation (Population) | 4.2% | 4.9% |
Similar Demographics by Unemployment Among Women with Children Ages 6 to 17 years
Demographics Similar to Immigrants from Afghanistan by Unemployment Among Women with Children Ages 6 to 17 years
In terms of unemployment among women with children ages 6 to 17 years, the demographic groups most similar to Immigrants from Afghanistan are Immigrants from Uzbekistan (7.8%, a difference of 0.33%), Immigrants from Eastern Asia (7.7%, a difference of 0.63%), Indian (Asian) (7.7%, a difference of 0.63%), Thai (7.8%, a difference of 0.67%), and Immigrants from Indonesia (7.7%, a difference of 0.76%).
| Demographics | Rating | Rank | Unemployment Among Women with Children Ages 6 to 17 years |
| Immigrants | Singapore | 100.0 /100 | #20 | Exceptional 7.7% |
| Immigrants | India | 100.0 /100 | #21 | Exceptional 7.7% |
| Immigrants | China | 100.0 /100 | #22 | Exceptional 7.7% |
| Immigrants | Indonesia | 100.0 /100 | #23 | Exceptional 7.7% |
| Nepalese | 100.0 /100 | #24 | Exceptional 7.7% |
| Immigrants | Eastern Asia | 100.0 /100 | #25 | Exceptional 7.7% |
| Indians (Asian) | 100.0 /100 | #26 | Exceptional 7.7% |
| Immigrants | Afghanistan | 100.0 /100 | #27 | Exceptional 7.8% |
| Immigrants | Uzbekistan | 100.0 /100 | #28 | Exceptional 7.8% |
| Thais | 100.0 /100 | #29 | Exceptional 7.8% |
| Immigrants | Iran | 100.0 /100 | #30 | Exceptional 7.9% |
| Laotians | 100.0 /100 | #31 | Exceptional 7.9% |
| Immigrants | Cambodia | 100.0 /100 | #32 | Exceptional 7.9% |
| Immigrants | Korea | 100.0 /100 | #33 | Exceptional 7.9% |
| Native Hawaiians | 100.0 /100 | #34 | Exceptional 7.9% |
Demographics Similar to Colombians by Unemployment Among Women with Children Ages 6 to 17 years
In terms of unemployment among women with children ages 6 to 17 years, the demographic groups most similar to Colombians are Immigrants from Colombia (9.3%, a difference of 0.020%), Guatemalan (9.3%, a difference of 0.070%), Scottish (9.4%, a difference of 0.11%), English (9.4%, a difference of 0.16%), and Immigrants from Cameroon (9.4%, a difference of 0.19%).
| Demographics | Rating | Rank | Unemployment Among Women with Children Ages 6 to 17 years |
| Mexicans | 3.2 /100 | #234 | Tragic 9.3% |
| Uruguayans | 3.0 /100 | #235 | Tragic 9.3% |
| Hungarians | 3.0 /100 | #236 | Tragic 9.3% |
| Immigrants | Belize | 2.8 /100 | #237 | Tragic 9.3% |
| Arabs | 2.7 /100 | #238 | Tragic 9.3% |
| Immigrants | Saudi Arabia | 2.7 /100 | #239 | Tragic 9.3% |
| Guatemalans | 2.3 /100 | #240 | Tragic 9.3% |
| Colombians | 2.2 /100 | #241 | Tragic 9.3% |
| Immigrants | Colombia | 2.1 /100 | #242 | Tragic 9.3% |
| Scottish | 2.0 /100 | #243 | Tragic 9.4% |
| English | 1.9 /100 | #244 | Tragic 9.4% |
| Immigrants | Cameroon | 1.8 /100 | #245 | Tragic 9.4% |
| Immigrants | Africa | 1.6 /100 | #246 | Tragic 9.4% |
| Poles | 1.5 /100 | #247 | Tragic 9.4% |
| Dutch | 1.5 /100 | #248 | Tragic 9.4% |