Houma vs Immigrants from the Azores 7th Grade
COMPARE
Houma
Immigrants from the Azores
7th Grade
7th Grade Comparison
Houma
Immigrants from the Azores
95.1%
7TH GRADE
0.2/ 100
METRIC RATING
270th/ 347
METRIC RANK
93.0%
7TH GRADE
0.0/ 100
METRIC RATING
329th/ 347
METRIC RANK
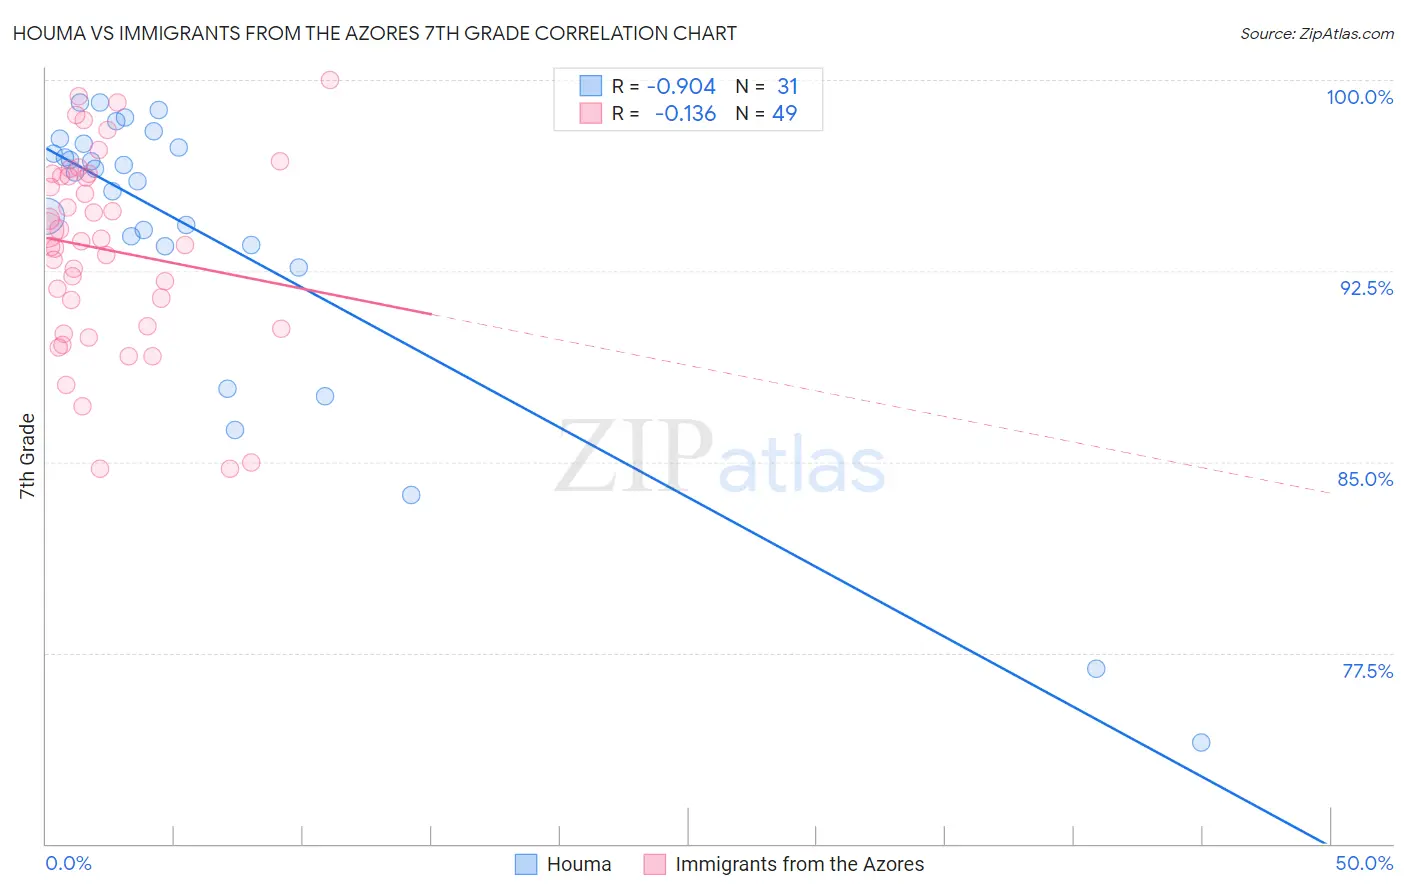
Houma vs Immigrants from the Azores 7th Grade Correlation Chart
The statistical analysis conducted on geographies consisting of 36,795,916 people shows a near-perfect negative correlation between the proportion of Houma and percentage of population with at least 7th grade education in the United States with a correlation coefficient (R) of -0.904 and weighted average of 95.1%. Similarly, the statistical analysis conducted on geographies consisting of 46,257,310 people shows a poor negative correlation between the proportion of Immigrants from the Azores and percentage of population with at least 7th grade education in the United States with a correlation coefficient (R) of -0.136 and weighted average of 93.0%, a difference of 2.4%.
7th Grade Correlation Summary
| Measurement | Houma | Immigrants from the Azores |
| Minimum | 74.0% | 84.7% |
| Maximum | 99.1% | 100.0% |
| Range | 25.2% | 15.3% |
| Mean | 93.8% | 93.3% |
| Median | 96.4% | 93.7% |
| Interquartile 25% (IQ1) | 93.5% | 90.3% |
| Interquartile 75% (IQ3) | 97.5% | 96.3% |
| Interquartile Range (IQR) | 4.0% | 6.0% |
| Standard Deviation (Sample) | 6.2% | 3.8% |
| Standard Deviation (Population) | 6.1% | 3.8% |
Similar Demographics by 7th Grade
Demographics Similar to Houma by 7th Grade
In terms of 7th grade, the demographic groups most similar to Houma are Immigrants from South America (95.1%, a difference of 0.0%), Peruvian (95.1%, a difference of 0.0%), Immigrants from Uzbekistan (95.1%, a difference of 0.010%), Immigrants from Western Africa (95.1%, a difference of 0.010%), and Trinidadian and Tobagonian (95.2%, a difference of 0.020%).
| Demographics | Rating | Rank | 7th Grade |
| West Indians | 0.5 /100 | #263 | Tragic 95.2% |
| Immigrants | Nigeria | 0.4 /100 | #264 | Tragic 95.2% |
| Immigrants | Uruguay | 0.3 /100 | #265 | Tragic 95.2% |
| Immigrants | Ghana | 0.3 /100 | #266 | Tragic 95.2% |
| Yuman | 0.3 /100 | #267 | Tragic 95.2% |
| Immigrants | Hong Kong | 0.3 /100 | #268 | Tragic 95.2% |
| Trinidadians and Tobagonians | 0.3 /100 | #269 | Tragic 95.2% |
| Houma | 0.2 /100 | #270 | Tragic 95.1% |
| Immigrants | South America | 0.2 /100 | #271 | Tragic 95.1% |
| Peruvians | 0.2 /100 | #272 | Tragic 95.1% |
| Immigrants | Uzbekistan | 0.2 /100 | #273 | Tragic 95.1% |
| Immigrants | Western Africa | 0.2 /100 | #274 | Tragic 95.1% |
| Immigrants | Colombia | 0.2 /100 | #275 | Tragic 95.1% |
| Immigrants | Thailand | 0.2 /100 | #276 | Tragic 95.1% |
| Immigrants | Afghanistan | 0.2 /100 | #277 | Tragic 95.1% |
Demographics Similar to Immigrants from the Azores by 7th Grade
In terms of 7th grade, the demographic groups most similar to Immigrants from the Azores are Immigrants from Nicaragua (93.0%, a difference of 0.040%), Immigrants from Dominican Republic (92.9%, a difference of 0.050%), Honduran (92.9%, a difference of 0.090%), Immigrants from Cabo Verde (93.1%, a difference of 0.17%), and Hispanic or Latino (92.7%, a difference of 0.23%).
| Demographics | Rating | Rank | 7th Grade |
| Nicaraguans | 0.0 /100 | #322 | Tragic 93.5% |
| Immigrants | Belize | 0.0 /100 | #323 | Tragic 93.4% |
| Dominicans | 0.0 /100 | #324 | Tragic 93.3% |
| Central American Indians | 0.0 /100 | #325 | Tragic 93.3% |
| Nepalese | 0.0 /100 | #326 | Tragic 93.2% |
| Immigrants | Cabo Verde | 0.0 /100 | #327 | Tragic 93.1% |
| Immigrants | Nicaragua | 0.0 /100 | #328 | Tragic 93.0% |
| Immigrants | Azores | 0.0 /100 | #329 | Tragic 93.0% |
| Immigrants | Dominican Republic | 0.0 /100 | #330 | Tragic 92.9% |
| Hondurans | 0.0 /100 | #331 | Tragic 92.9% |
| Hispanics or Latinos | 0.0 /100 | #332 | Tragic 92.7% |
| Immigrants | Armenia | 0.0 /100 | #333 | Tragic 92.7% |
| Immigrants | Yemen | 0.0 /100 | #334 | Tragic 92.6% |
| Mexican American Indians | 0.0 /100 | #335 | Tragic 92.6% |
| Immigrants | Honduras | 0.0 /100 | #336 | Tragic 92.5% |