Houma vs Immigrants from Indonesia 7th Grade
COMPARE
Houma
Immigrants from Indonesia
7th Grade
7th Grade Comparison
Houma
Immigrants from Indonesia
95.1%
7TH GRADE
0.2/ 100
METRIC RATING
270th/ 347
METRIC RANK
95.5%
7TH GRADE
3.3/ 100
METRIC RATING
233rd/ 347
METRIC RANK
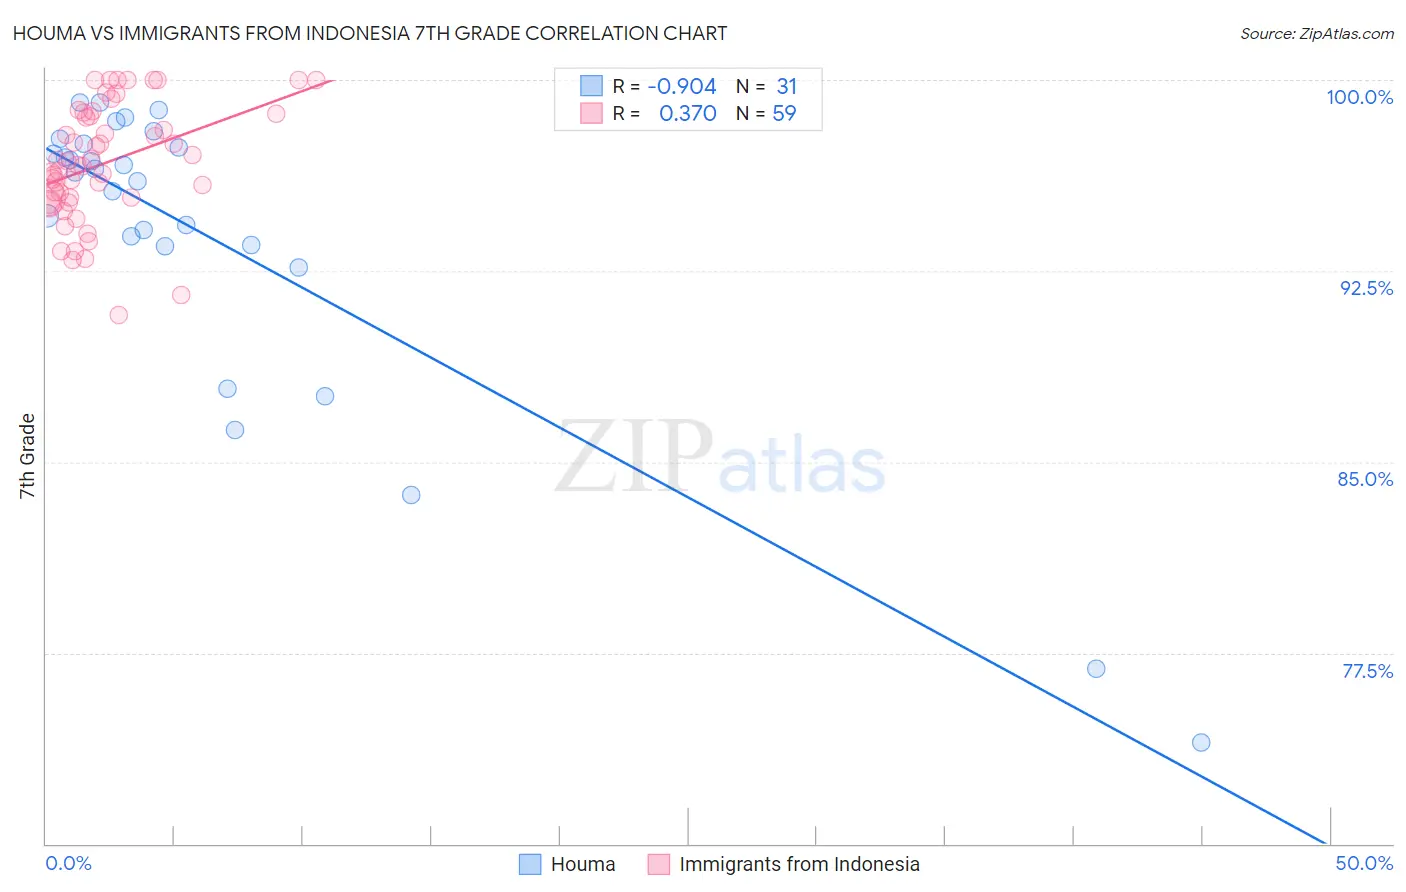
Houma vs Immigrants from Indonesia 7th Grade Correlation Chart
The statistical analysis conducted on geographies consisting of 36,795,916 people shows a near-perfect negative correlation between the proportion of Houma and percentage of population with at least 7th grade education in the United States with a correlation coefficient (R) of -0.904 and weighted average of 95.1%. Similarly, the statistical analysis conducted on geographies consisting of 215,671,959 people shows a mild positive correlation between the proportion of Immigrants from Indonesia and percentage of population with at least 7th grade education in the United States with a correlation coefficient (R) of 0.370 and weighted average of 95.5%, a difference of 0.42%.
7th Grade Correlation Summary
| Measurement | Houma | Immigrants from Indonesia |
| Minimum | 74.0% | 90.7% |
| Maximum | 99.1% | 100.0% |
| Range | 25.2% | 9.3% |
| Mean | 93.8% | 96.7% |
| Median | 96.4% | 96.7% |
| Interquartile 25% (IQ1) | 93.5% | 95.4% |
| Interquartile 75% (IQ3) | 97.5% | 98.7% |
| Interquartile Range (IQR) | 4.0% | 3.3% |
| Standard Deviation (Sample) | 6.2% | 2.3% |
| Standard Deviation (Population) | 6.1% | 2.3% |
Similar Demographics by 7th Grade
Demographics Similar to Houma by 7th Grade
In terms of 7th grade, the demographic groups most similar to Houma are Immigrants from South America (95.1%, a difference of 0.0%), Peruvian (95.1%, a difference of 0.0%), Immigrants from Uzbekistan (95.1%, a difference of 0.010%), Immigrants from Western Africa (95.1%, a difference of 0.010%), and Trinidadian and Tobagonian (95.2%, a difference of 0.020%).
| Demographics | Rating | Rank | 7th Grade |
| West Indians | 0.5 /100 | #263 | Tragic 95.2% |
| Immigrants | Nigeria | 0.4 /100 | #264 | Tragic 95.2% |
| Immigrants | Uruguay | 0.3 /100 | #265 | Tragic 95.2% |
| Immigrants | Ghana | 0.3 /100 | #266 | Tragic 95.2% |
| Yuman | 0.3 /100 | #267 | Tragic 95.2% |
| Immigrants | Hong Kong | 0.3 /100 | #268 | Tragic 95.2% |
| Trinidadians and Tobagonians | 0.3 /100 | #269 | Tragic 95.2% |
| Houma | 0.2 /100 | #270 | Tragic 95.1% |
| Immigrants | South America | 0.2 /100 | #271 | Tragic 95.1% |
| Peruvians | 0.2 /100 | #272 | Tragic 95.1% |
| Immigrants | Uzbekistan | 0.2 /100 | #273 | Tragic 95.1% |
| Immigrants | Western Africa | 0.2 /100 | #274 | Tragic 95.1% |
| Immigrants | Colombia | 0.2 /100 | #275 | Tragic 95.1% |
| Immigrants | Thailand | 0.2 /100 | #276 | Tragic 95.1% |
| Immigrants | Afghanistan | 0.2 /100 | #277 | Tragic 95.1% |
Demographics Similar to Immigrants from Indonesia by 7th Grade
In terms of 7th grade, the demographic groups most similar to Immigrants from Indonesia are Costa Rican (95.5%, a difference of 0.0%), Nigerian (95.5%, a difference of 0.020%), Senegalese (95.6%, a difference of 0.030%), Immigrants from Africa (95.5%, a difference of 0.030%), and Native/Alaskan (95.6%, a difference of 0.040%).
| Demographics | Rating | Rank | 7th Grade |
| Immigrants | Eastern Asia | 5.8 /100 | #226 | Tragic 95.6% |
| Immigrants | Western Asia | 5.4 /100 | #227 | Tragic 95.6% |
| Immigrants | Eastern Africa | 5.1 /100 | #228 | Tragic 95.6% |
| Immigrants | Panama | 4.9 /100 | #229 | Tragic 95.6% |
| Natives/Alaskans | 4.2 /100 | #230 | Tragic 95.6% |
| Senegalese | 4.0 /100 | #231 | Tragic 95.6% |
| Costa Ricans | 3.3 /100 | #232 | Tragic 95.5% |
| Immigrants | Indonesia | 3.3 /100 | #233 | Tragic 95.5% |
| Nigerians | 3.0 /100 | #234 | Tragic 95.5% |
| Immigrants | Africa | 2.7 /100 | #235 | Tragic 95.5% |
| Asians | 2.6 /100 | #236 | Tragic 95.5% |
| Immigrants | Asia | 2.3 /100 | #237 | Tragic 95.5% |
| Indians (Asian) | 2.3 /100 | #238 | Tragic 95.5% |
| Jamaicans | 2.2 /100 | #239 | Tragic 95.5% |
| Immigrants | Sierra Leone | 2.0 /100 | #240 | Tragic 95.5% |