Houma vs U.S. Virgin Islander Unemployment Among Women with Children Under 18 years
COMPARE
Houma
U.S. Virgin Islander
Unemployment Among Women with Children Under 18 years
Unemployment Among Women with Children Under 18 years Comparison
Houma
U.S. Virgin Islanders
6.8%
UNEMPLOYMENT AMONG WOMEN WITH CHILDREN UNDER 18 YEARS
0.0/ 100
METRIC RATING
322nd/ 347
METRIC RANK
6.7%
UNEMPLOYMENT AMONG WOMEN WITH CHILDREN UNDER 18 YEARS
0.0/ 100
METRIC RATING
321st/ 347
METRIC RANK
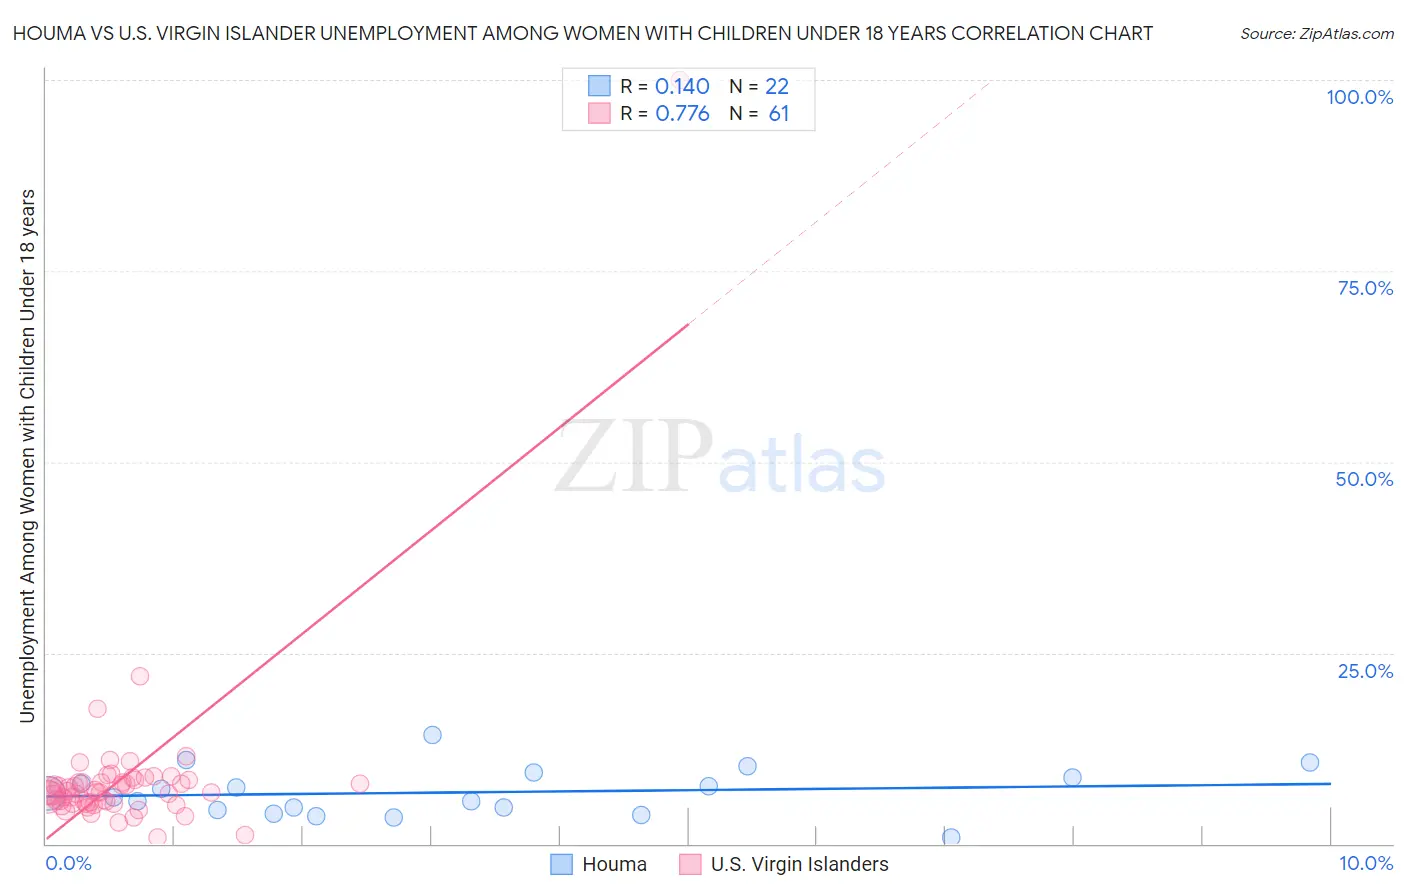
Houma vs U.S. Virgin Islander Unemployment Among Women with Children Under 18 years Correlation Chart
The statistical analysis conducted on geographies consisting of 36,457,535 people shows a poor positive correlation between the proportion of Houma and unemployment rate among women with children under the age of 18 in the United States with a correlation coefficient (R) of 0.140 and weighted average of 6.8%. Similarly, the statistical analysis conducted on geographies consisting of 86,931,523 people shows a strong positive correlation between the proportion of U.S. Virgin Islanders and unemployment rate among women with children under the age of 18 in the United States with a correlation coefficient (R) of 0.776 and weighted average of 6.7%, a difference of 2.0%.
Unemployment Among Women with Children Under 18 years Correlation Summary
| Measurement | Houma | U.S. Virgin Islander |
| Minimum | 0.90% | 0.80% |
| Maximum | 14.2% | 100.0% |
| Range | 13.3% | 99.2% |
| Mean | 6.7% | 8.6% |
| Median | 6.4% | 6.7% |
| Interquartile 25% (IQ1) | 4.5% | 5.3% |
| Interquartile 75% (IQ3) | 8.7% | 8.2% |
| Interquartile Range (IQR) | 4.2% | 2.8% |
| Standard Deviation (Sample) | 3.1% | 12.3% |
| Standard Deviation (Population) | 3.0% | 12.2% |
Demographics Similar to Houma and U.S. Virgin Islanders by Unemployment Among Women with Children Under 18 years
In terms of unemployment among women with children under 18 years, the demographic groups most similar to Houma are Pueblo (6.8%, a difference of 0.19%), Paiute (6.9%, a difference of 1.1%), Immigrants from Belize (6.7%, a difference of 2.0%), Central American Indian (6.7%, a difference of 2.1%), and Immigrants from Dominica (7.0%, a difference of 2.3%). Similarly, the demographic groups most similar to U.S. Virgin Islanders are Immigrants from Belize (6.7%, a difference of 0.050%), Central American Indian (6.7%, a difference of 0.14%), Alaska Native (6.7%, a difference of 0.39%), Shoshone (6.6%, a difference of 0.68%), and Immigrants from Ecuador (6.6%, a difference of 0.72%).
| Demographics | Rating | Rank | Unemployment Among Women with Children Under 18 years |
| Yaqui | 0.0 /100 | #311 | Tragic 6.6% |
| Immigrants | Mexico | 0.0 /100 | #312 | Tragic 6.6% |
| Hispanics or Latinos | 0.0 /100 | #313 | Tragic 6.6% |
| British West Indians | 0.0 /100 | #314 | Tragic 6.6% |
| Immigrants | West Indies | 0.0 /100 | #315 | Tragic 6.6% |
| Immigrants | Ecuador | 0.0 /100 | #316 | Tragic 6.6% |
| Shoshone | 0.0 /100 | #317 | Tragic 6.6% |
| Alaska Natives | 0.0 /100 | #318 | Tragic 6.7% |
| Central American Indians | 0.0 /100 | #319 | Tragic 6.7% |
| Immigrants | Belize | 0.0 /100 | #320 | Tragic 6.7% |
| U.S. Virgin Islanders | 0.0 /100 | #321 | Tragic 6.7% |
| Houma | 0.0 /100 | #322 | Tragic 6.8% |
| Pueblo | 0.0 /100 | #323 | Tragic 6.8% |
| Paiute | 0.0 /100 | #324 | Tragic 6.9% |
| Immigrants | Dominica | 0.0 /100 | #325 | Tragic 7.0% |
| Chippewa | 0.0 /100 | #326 | Tragic 7.0% |
| Lumbee | 0.0 /100 | #327 | Tragic 7.1% |
| Natives/Alaskans | 0.0 /100 | #328 | Tragic 7.2% |
| Blacks/African Americans | 0.0 /100 | #329 | Tragic 7.3% |
| Colville | 0.0 /100 | #330 | Tragic 7.4% |
| Hopi | 0.0 /100 | #331 | Tragic 7.4% |