Houma vs U.S. Virgin Islander Unemployment Among Ages 45 to 54 years
COMPARE
Houma
U.S. Virgin Islander
Unemployment Among Ages 45 to 54 years
Unemployment Among Ages 45 to 54 years Comparison
Houma
U.S. Virgin Islanders
5.6%
UNEMPLOYMENT AMONG AGES 45 TO 54 YEARS
0.0/ 100
METRIC RATING
317th/ 347
METRIC RANK
5.0%
UNEMPLOYMENT AMONG AGES 45 TO 54 YEARS
0.0/ 100
METRIC RATING
274th/ 347
METRIC RANK
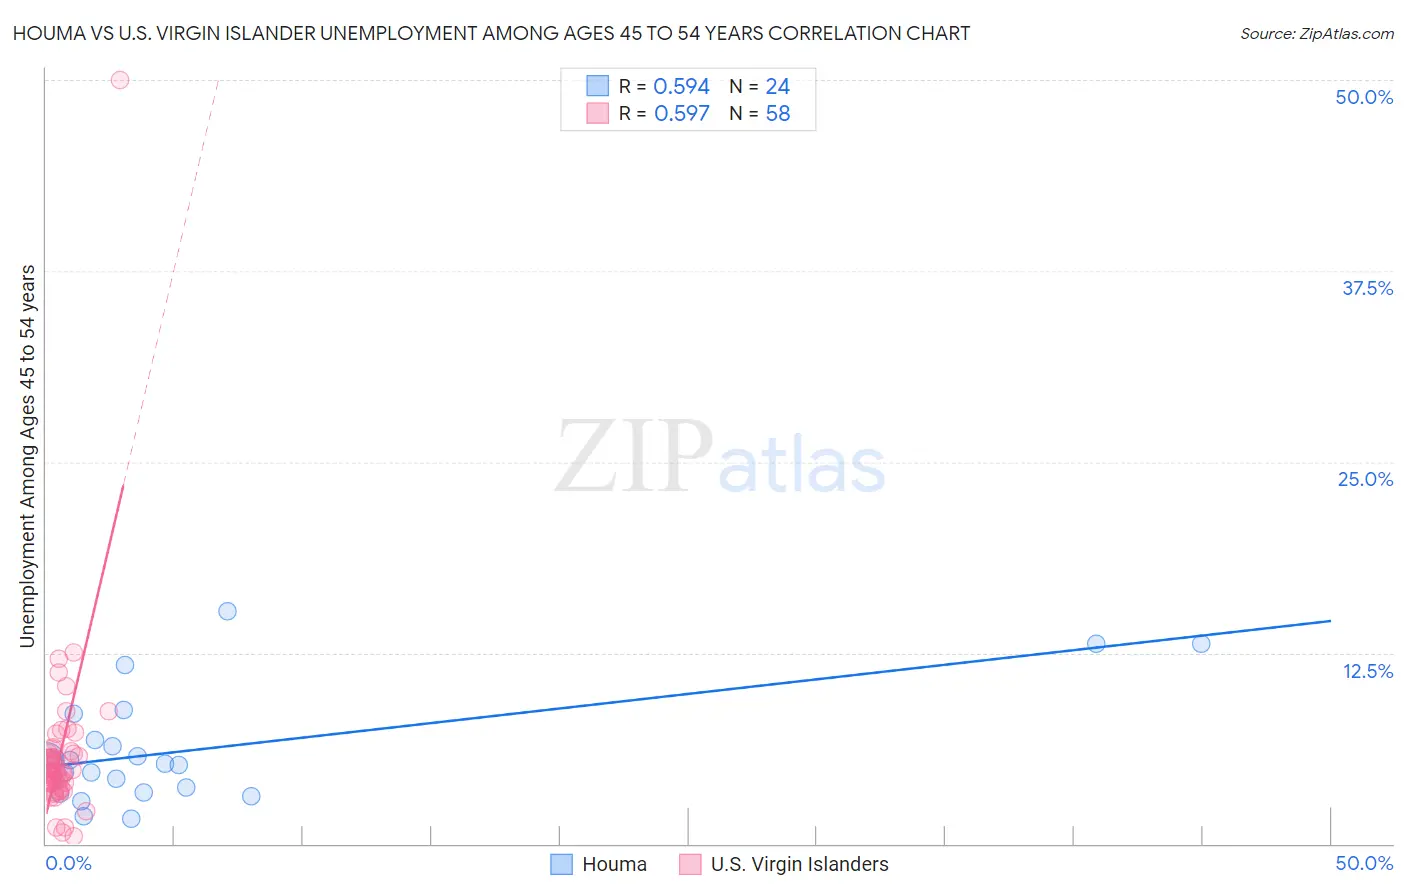
Houma vs U.S. Virgin Islander Unemployment Among Ages 45 to 54 years Correlation Chart
The statistical analysis conducted on geographies consisting of 36,494,727 people shows a substantial positive correlation between the proportion of Houma and unemployment rate among population between the ages 45 and 54 in the United States with a correlation coefficient (R) of 0.594 and weighted average of 5.6%. Similarly, the statistical analysis conducted on geographies consisting of 87,109,924 people shows a substantial positive correlation between the proportion of U.S. Virgin Islanders and unemployment rate among population between the ages 45 and 54 in the United States with a correlation coefficient (R) of 0.597 and weighted average of 5.0%, a difference of 13.0%.
Unemployment Among Ages 45 to 54 years Correlation Summary
| Measurement | Houma | U.S. Virgin Islander |
| Minimum | 1.6% | 0.50% |
| Maximum | 15.2% | 50.0% |
| Range | 13.6% | 49.5% |
| Mean | 6.2% | 5.9% |
| Median | 5.3% | 4.7% |
| Interquartile 25% (IQ1) | 3.5% | 4.0% |
| Interquartile 75% (IQ3) | 7.6% | 5.9% |
| Interquartile Range (IQR) | 4.1% | 1.9% |
| Standard Deviation (Sample) | 3.7% | 6.4% |
| Standard Deviation (Population) | 3.6% | 6.3% |
Similar Demographics by Unemployment Among Ages 45 to 54 years
Demographics Similar to Houma by Unemployment Among Ages 45 to 54 years
In terms of unemployment among ages 45 to 54 years, the demographic groups most similar to Houma are Immigrants from Guyana (5.6%, a difference of 0.10%), Immigrants from Dominica (5.6%, a difference of 0.30%), Guyanese (5.6%, a difference of 0.48%), British West Indian (5.7%, a difference of 0.63%), and Shoshone (5.6%, a difference of 0.81%).
| Demographics | Rating | Rank | Unemployment Among Ages 45 to 54 years |
| Immigrants | Barbados | 0.0 /100 | #310 | Tragic 5.5% |
| Chippewa | 0.0 /100 | #311 | Tragic 5.5% |
| Immigrants | Grenada | 0.0 /100 | #312 | Tragic 5.6% |
| Shoshone | 0.0 /100 | #313 | Tragic 5.6% |
| Guyanese | 0.0 /100 | #314 | Tragic 5.6% |
| Immigrants | Dominica | 0.0 /100 | #315 | Tragic 5.6% |
| Immigrants | Guyana | 0.0 /100 | #316 | Tragic 5.6% |
| Houma | 0.0 /100 | #317 | Tragic 5.6% |
| British West Indians | 0.0 /100 | #318 | Tragic 5.7% |
| Cape Verdeans | 0.0 /100 | #319 | Tragic 5.7% |
| Immigrants | St. Vincent and the Grenadines | 0.0 /100 | #320 | Tragic 5.7% |
| Yakama | 0.0 /100 | #321 | Tragic 5.7% |
| Immigrants | Azores | 0.0 /100 | #322 | Tragic 5.7% |
| Immigrants | Cabo Verde | 0.0 /100 | #323 | Tragic 5.9% |
| Natives/Alaskans | 0.0 /100 | #324 | Tragic 6.1% |
Demographics Similar to U.S. Virgin Islanders by Unemployment Among Ages 45 to 54 years
In terms of unemployment among ages 45 to 54 years, the demographic groups most similar to U.S. Virgin Islanders are Immigrants from Latin America (5.0%, a difference of 0.050%), Bermudan (5.0%, a difference of 0.050%), Immigrants from Central America (5.0%, a difference of 0.22%), Cajun (5.0%, a difference of 0.39%), and Immigrants from Ghana (5.0%, a difference of 0.46%).
| Demographics | Rating | Rank | Unemployment Among Ages 45 to 54 years |
| Bahamians | 0.0 /100 | #267 | Tragic 4.9% |
| Immigrants | Uzbekistan | 0.0 /100 | #268 | Tragic 4.9% |
| Somalis | 0.0 /100 | #269 | Tragic 5.0% |
| Immigrants | Ghana | 0.0 /100 | #270 | Tragic 5.0% |
| Cajuns | 0.0 /100 | #271 | Tragic 5.0% |
| Immigrants | Central America | 0.0 /100 | #272 | Tragic 5.0% |
| Immigrants | Latin America | 0.0 /100 | #273 | Tragic 5.0% |
| U.S. Virgin Islanders | 0.0 /100 | #274 | Tragic 5.0% |
| Bermudans | 0.0 /100 | #275 | Tragic 5.0% |
| French American Indians | 0.0 /100 | #276 | Tragic 5.0% |
| Immigrants | Mexico | 0.0 /100 | #277 | Tragic 5.0% |
| Dutch West Indians | 0.0 /100 | #278 | Tragic 5.0% |
| Nepalese | 0.0 /100 | #279 | Tragic 5.0% |
| Blackfeet | 0.0 /100 | #280 | Tragic 5.1% |
| Spanish American Indians | 0.0 /100 | #281 | Tragic 5.1% |