Houma vs Immigrants from Austria 4th Grade
COMPARE
Houma
Immigrants from Austria
4th Grade
4th Grade Comparison
Houma
Immigrants from Austria
96.8%
4TH GRADE
0.0/ 100
METRIC RATING
287th/ 347
METRIC RANK
98.0%
4TH GRADE
99.6/ 100
METRIC RATING
70th/ 347
METRIC RANK
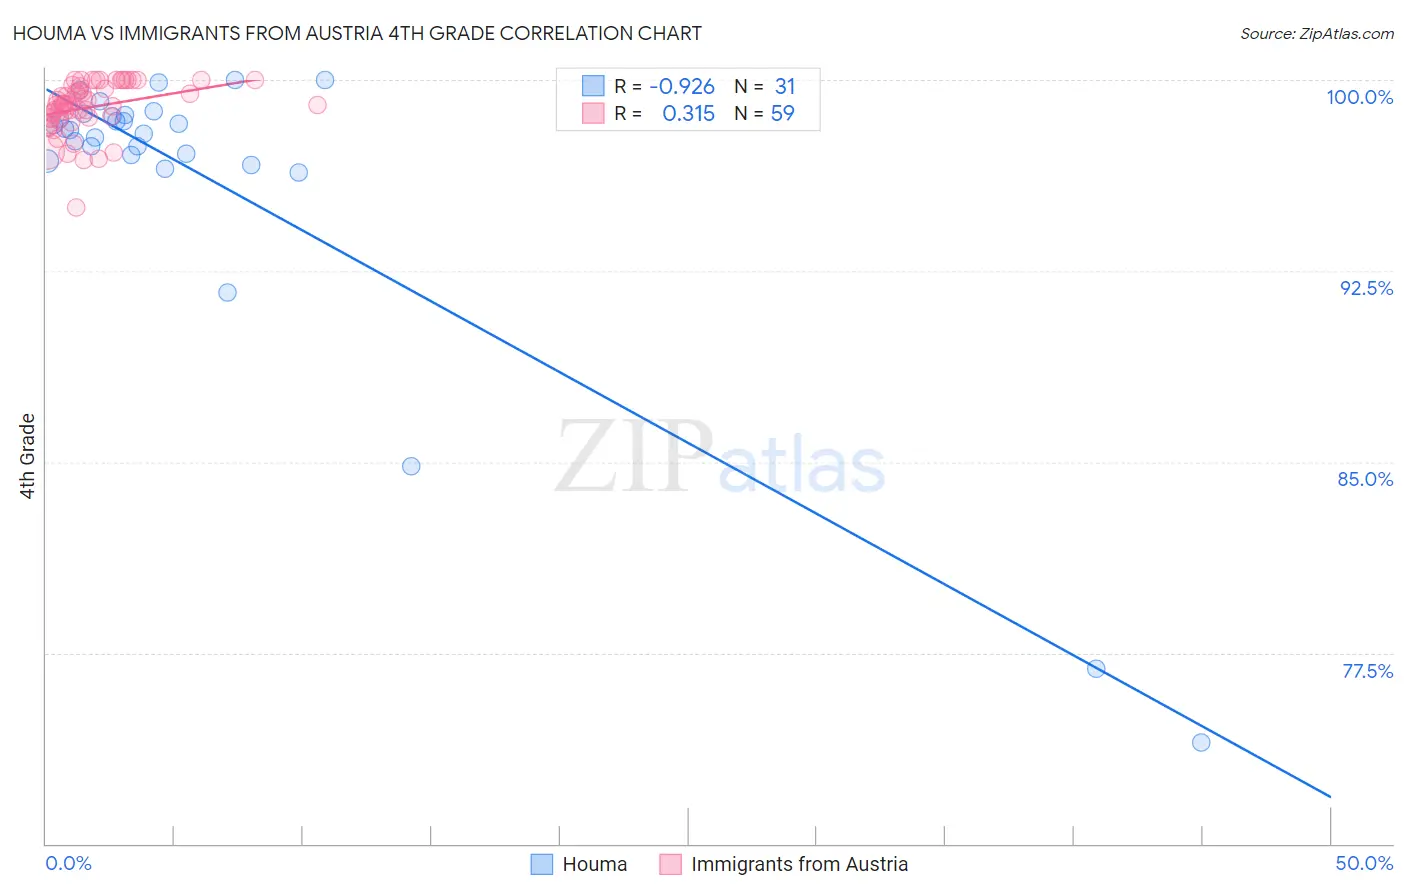
Houma vs Immigrants from Austria 4th Grade Correlation Chart
The statistical analysis conducted on geographies consisting of 36,795,916 people shows a near-perfect negative correlation between the proportion of Houma and percentage of population with at least 4th grade education in the United States with a correlation coefficient (R) of -0.926 and weighted average of 96.8%. Similarly, the statistical analysis conducted on geographies consisting of 167,973,800 people shows a mild positive correlation between the proportion of Immigrants from Austria and percentage of population with at least 4th grade education in the United States with a correlation coefficient (R) of 0.315 and weighted average of 98.0%, a difference of 1.3%.
4th Grade Correlation Summary
| Measurement | Houma | Immigrants from Austria |
| Minimum | 74.0% | 95.0% |
| Maximum | 100.0% | 100.0% |
| Range | 26.0% | 5.0% |
| Mean | 96.0% | 98.9% |
| Median | 98.1% | 99.0% |
| Interquartile 25% (IQ1) | 96.8% | 98.5% |
| Interquartile 75% (IQ3) | 98.6% | 99.8% |
| Interquartile Range (IQR) | 1.8% | 1.3% |
| Standard Deviation (Sample) | 6.2% | 1.0% |
| Standard Deviation (Population) | 6.1% | 1.0% |
Similar Demographics by 4th Grade
Demographics Similar to Houma by 4th Grade
In terms of 4th grade, the demographic groups most similar to Houma are Immigrants from Afghanistan (96.8%, a difference of 0.0%), Immigrants from West Indies (96.7%, a difference of 0.020%), British West Indian (96.7%, a difference of 0.030%), Immigrants from Barbados (96.8%, a difference of 0.040%), and Immigrants from Thailand (96.8%, a difference of 0.040%).
| Demographics | Rating | Rank | 4th Grade |
| Barbadians | 0.1 /100 | #280 | Tragic 96.9% |
| Immigrants | Hong Kong | 0.1 /100 | #281 | Tragic 96.9% |
| Immigrants | Trinidad and Tobago | 0.1 /100 | #282 | Tragic 96.8% |
| Immigrants | Philippines | 0.1 /100 | #283 | Tragic 96.8% |
| Immigrants | St. Vincent and the Grenadines | 0.1 /100 | #284 | Tragic 96.8% |
| Immigrants | Barbados | 0.0 /100 | #285 | Tragic 96.8% |
| Immigrants | Thailand | 0.0 /100 | #286 | Tragic 96.8% |
| Houma | 0.0 /100 | #287 | Tragic 96.8% |
| Immigrants | Afghanistan | 0.0 /100 | #288 | Tragic 96.8% |
| Immigrants | West Indies | 0.0 /100 | #289 | Tragic 96.7% |
| British West Indians | 0.0 /100 | #290 | Tragic 96.7% |
| Immigrants | Grenada | 0.0 /100 | #291 | Tragic 96.7% |
| Malaysians | 0.0 /100 | #292 | Tragic 96.7% |
| Puerto Ricans | 0.0 /100 | #293 | Tragic 96.7% |
| Immigrants | Eritrea | 0.0 /100 | #294 | Tragic 96.7% |
Demographics Similar to Immigrants from Austria by 4th Grade
In terms of 4th grade, the demographic groups most similar to Immigrants from Austria are Kiowa (98.0%, a difference of 0.0%), Pueblo (98.0%, a difference of 0.0%), Lumbee (98.0%, a difference of 0.0%), Immigrants from Northern Europe (98.0%, a difference of 0.010%), and Canadian (98.0%, a difference of 0.010%).
| Demographics | Rating | Rank | 4th Grade |
| Russians | 99.7 /100 | #63 | Exceptional 98.0% |
| Cajuns | 99.7 /100 | #64 | Exceptional 98.0% |
| Immigrants | Northern Europe | 99.6 /100 | #65 | Exceptional 98.0% |
| Canadians | 99.6 /100 | #66 | Exceptional 98.0% |
| New Zealanders | 99.6 /100 | #67 | Exceptional 98.0% |
| Kiowa | 99.6 /100 | #68 | Exceptional 98.0% |
| Pueblo | 99.6 /100 | #69 | Exceptional 98.0% |
| Immigrants | Austria | 99.6 /100 | #70 | Exceptional 98.0% |
| Lumbee | 99.6 /100 | #71 | Exceptional 98.0% |
| Iranians | 99.4 /100 | #72 | Exceptional 98.0% |
| Macedonians | 99.4 /100 | #73 | Exceptional 98.0% |
| Chickasaw | 99.4 /100 | #74 | Exceptional 98.0% |
| Immigrants | Netherlands | 99.3 /100 | #75 | Exceptional 98.0% |
| Cherokee | 99.3 /100 | #76 | Exceptional 98.0% |
| Immigrants | Lithuania | 99.3 /100 | #77 | Exceptional 98.0% |