Egyptian vs Immigrants from Russia 4th Grade
COMPARE
Egyptian
Immigrants from Russia
4th Grade
4th Grade Comparison
Egyptians
Immigrants from Russia
97.5%
4TH GRADE
50.0/ 100
METRIC RATING
174th/ 347
METRIC RANK
97.6%
4TH GRADE
67.0/ 100
METRIC RATING
154th/ 347
METRIC RANK
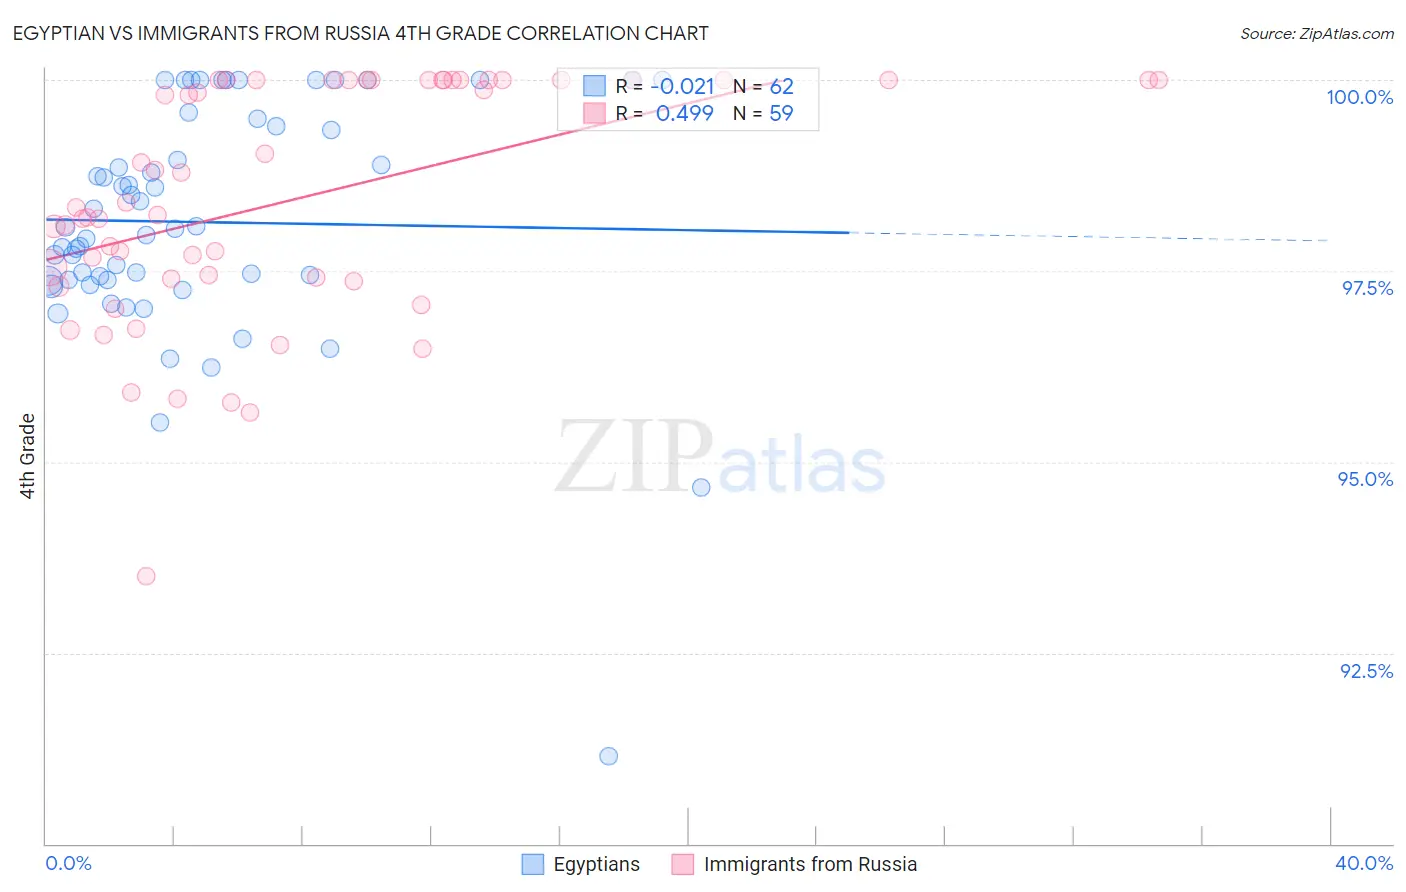
Egyptian vs Immigrants from Russia 4th Grade Correlation Chart
The statistical analysis conducted on geographies consisting of 276,927,423 people shows no correlation between the proportion of Egyptians and percentage of population with at least 4th grade education in the United States with a correlation coefficient (R) of -0.021 and weighted average of 97.5%. Similarly, the statistical analysis conducted on geographies consisting of 347,948,494 people shows a moderate positive correlation between the proportion of Immigrants from Russia and percentage of population with at least 4th grade education in the United States with a correlation coefficient (R) of 0.499 and weighted average of 97.6%, a difference of 0.070%.
4th Grade Correlation Summary
| Measurement | Egyptian | Immigrants from Russia |
| Minimum | 91.1% | 93.5% |
| Maximum | 100.0% | 100.0% |
| Range | 8.9% | 6.5% |
| Mean | 98.1% | 98.4% |
| Median | 98.1% | 98.3% |
| Interquartile 25% (IQ1) | 97.4% | 97.4% |
| Interquartile 75% (IQ3) | 99.4% | 100.0% |
| Interquartile Range (IQR) | 2.0% | 2.6% |
| Standard Deviation (Sample) | 1.6% | 1.6% |
| Standard Deviation (Population) | 1.5% | 1.5% |
Demographics Similar to Egyptians and Immigrants from Russia by 4th Grade
In terms of 4th grade, the demographic groups most similar to Egyptians are Immigrants from Sri Lanka (97.5%, a difference of 0.0%), Immigrants from Korea (97.5%, a difference of 0.0%), Immigrants from Spain (97.5%, a difference of 0.010%), Brazilian (97.5%, a difference of 0.010%), and Kenyan (97.5%, a difference of 0.020%). Similarly, the demographic groups most similar to Immigrants from Russia are Albanian (97.6%, a difference of 0.0%), Immigrants from Jordan (97.6%, a difference of 0.0%), Immigrants from Bosnia and Herzegovina (97.6%, a difference of 0.0%), French American Indian (97.6%, a difference of 0.0%), and Immigrants from Italy (97.6%, a difference of 0.010%).
| Demographics | Rating | Rank | 4th Grade |
| Immigrants | Russia | 67.0 /100 | #154 | Good 97.6% |
| Albanians | 67.0 /100 | #155 | Good 97.6% |
| Immigrants | Jordan | 66.9 /100 | #156 | Good 97.6% |
| Immigrants | Bosnia and Herzegovina | 66.0 /100 | #157 | Good 97.6% |
| French American Indians | 65.9 /100 | #158 | Good 97.6% |
| Immigrants | Italy | 63.7 /100 | #159 | Good 97.6% |
| Apache | 61.3 /100 | #160 | Good 97.6% |
| Marshallese | 60.8 /100 | #161 | Good 97.6% |
| Bermudans | 60.5 /100 | #162 | Good 97.6% |
| Immigrants | Iran | 60.3 /100 | #163 | Good 97.6% |
| Ugandans | 58.9 /100 | #164 | Average 97.6% |
| Venezuelans | 58.7 /100 | #165 | Average 97.6% |
| Kenyans | 56.5 /100 | #166 | Average 97.5% |
| Immigrants | Poland | 55.9 /100 | #167 | Average 97.5% |
| Immigrants | Belarus | 55.8 /100 | #168 | Average 97.5% |
| Chileans | 54.4 /100 | #169 | Average 97.5% |
| Immigrants | Spain | 51.8 /100 | #170 | Average 97.5% |
| Brazilians | 51.5 /100 | #171 | Average 97.5% |
| Immigrants | Sri Lanka | 51.1 /100 | #172 | Average 97.5% |
| Immigrants | Korea | 50.6 /100 | #173 | Average 97.5% |
| Egyptians | 50.0 /100 | #174 | Average 97.5% |