Italian vs Immigrants from Russia 4th Grade

COMPARE

Italian
Race
Ancestry
AfghanAfricanAlaska NativeAlaskan AthabascanAlbanianAleutAlsatianAmericanApacheArabArapahoArgentineanArmenianAssyrian/Chaldean/SyriacAustralianAustrianBahamianBangladeshiBarbadianBasqueBelgianBelizeanBermudanBhutaneseBlackfeetBolivianBrazilianBritishBritish West IndianBulgarianBurmeseCajunCambodianCanadianCape VerdeanCarpatho RusynCelticCentral AmericanCentral American IndianCherokeeCheyenneChickasawChileanChineseChippewaChoctawColombianColvilleComancheCosta RicanCreeCreekCroatianCrowCubanCypriotCzechCzechoslovakianDanishDelawareDominicanDutchDutch West IndianEastern EuropeanEcuadorianEgyptianEnglishEstonianEthiopianEuropeanFijianFilipinoFinnishFrenchFrench American IndianFrench CanadianGermanGerman RussianGhanaianGreekGuamanian/ChamorroGuatemalanGuyaneseHaitianHmongHonduranHopiHoumaHungarianIcelanderIndian (Asian)IndonesianInupiatIranianIraqiIrishIroquoisIsraeliItalianJamaicanJapaneseJordanianKenyanKiowaKoreanLaotianLatvianLebaneseLiberianLithuanianLumbeeLuxembourgerMacedonianMalaysianMalteseMarshalleseMenomineeMexicanMexican American IndianMongolianMoroccanNative HawaiianNavajoNepaleseNew ZealanderNicaraguanNigerianNorthern EuropeanNorwegianOkinawanOsageOttawaPaiutePakistaniPalestinianPanamanianParaguayanPennsylvania GermanPeruvianPimaPolishPortuguesePotawatomiPuebloPuerto RicanPuget Sound SalishRomanianRussianSalvadoranSamoanScandinavianScotch-IrishScottishSeminoleSenegaleseSerbianShoshoneSierra LeoneanSiouxSlavicSlovakSloveneSomaliSouth AfricanSouth AmericanSouth American IndianSoviet UnionSpaniardSpanishSpanish AmericanSpanish American IndianSri LankanSubsaharan AfricanSudaneseSwedishSwissSyrianTaiwaneseThaiTlingit-HaidaTohono O'OdhamTonganTrinidadian and TobagonianTsimshianTurkishU.S. Virgin IslanderUgandanUkrainianUruguayanUteVenezuelanVietnameseWelshWest IndianYakamaYaquiYugoslavianYumanYup'ikZimbabwean
Immigration
NonimmigrantsImmigrantsAfghanistanAfricaAlbaniaArgentinaArmeniaAsiaAustraliaAustriaBahamasBangladeshBarbadosBelarusBelgiumBelizeBoliviaBosnia and HerzegovinaBrazilBulgariaBurma/MyanmarCabo VerdeCambodiaCameroonCanadaCaribbeanCentral AmericaChileChinaColombiaCongoCosta RicaCroatiaCubaCzechoslovakiaDenmarkDominicaDominican RepublicEastern AfricaEastern AsiaEastern EuropeEcuadorEgyptEl SalvadorEnglandEritreaEthiopiaEuropeFijiFranceGermanyGhanaGreeceGrenadaGuatemalaGuyanaHaitiHondurasHong KongHungaryIndiaIndonesiaIranIraqIrelandIsraelItalyJamaicaJapanJordanKazakhstanKenyaKoreaKuwaitLaosLatin AmericaLatviaLebanonLiberiaLithuaniaMalaysiaMexicoMicronesiaMiddle AfricaMoldovaMoroccoNepalNetherlandsNicaraguaNigeriaNorth AmericaNorth MacedoniaNorthern AfricaNorthern EuropeNorwayOceaniaPakistanPanamaPeruPhilippinesPolandPortugalRomaniaSaudi ArabiaScotlandSenegalSerbiaSierra LeoneSingaporeSomaliaSouth AfricaSouth AmericaSouth Central AsiaSouth Eastern AsiaSouthern EuropeSpainSri LankaSt. Vincent and the GrenadinesSudanSwedenSwitzerlandSyriaTaiwanThailandTrinidad and TobagoTurkeyUgandaUkraineUruguayUzbekistanVenezuelaVietnamWest IndiesWestern AfricaWestern AsiaWestern EuropeYemenZaireZimbabweAzores
Immigrants from Russia
Race
Ancestry
AfghanAfricanAlaska NativeAlaskan AthabascanAlbanianAleutAlsatianAmericanApacheArabArapahoArgentineanArmenianAssyrian/Chaldean/SyriacAustralianAustrianBahamianBangladeshiBarbadianBasqueBelgianBelizeanBermudanBhutaneseBlackfeetBolivianBrazilianBritishBritish West IndianBulgarianBurmeseCajunCambodianCanadianCape VerdeanCarpatho RusynCelticCentral AmericanCentral American IndianCherokeeCheyenneChickasawChileanChineseChippewaChoctawColombianColvilleComancheCosta RicanCreeCreekCroatianCrowCubanCypriotCzechCzechoslovakianDanishDelawareDominicanDutchDutch West IndianEastern EuropeanEcuadorianEgyptianEnglishEstonianEthiopianEuropeanFijianFilipinoFinnishFrenchFrench American IndianFrench CanadianGermanGerman RussianGhanaianGreekGuamanian/ChamorroGuatemalanGuyaneseHaitianHmongHonduranHopiHoumaHungarianIcelanderIndian (Asian)IndonesianInupiatIranianIraqiIrishIroquoisIsraeliJamaicanJapaneseJordanianKenyanKiowaKoreanLaotianLatvianLebaneseLiberianLithuanianLumbeeLuxembourgerMacedonianMalaysianMalteseMarshalleseMenomineeMexicanMexican American IndianMongolianMoroccanNative HawaiianNavajoNepaleseNew ZealanderNicaraguanNigerianNorthern EuropeanNorwegianOkinawanOsageOttawaPaiutePakistaniPalestinianPanamanianParaguayanPennsylvania GermanPeruvianPimaPolishPortuguesePotawatomiPuebloPuerto RicanPuget Sound SalishRomanianRussianSalvadoranSamoanScandinavianScotch-IrishScottishSeminoleSenegaleseSerbianShoshoneSierra LeoneanSiouxSlavicSlovakSloveneSomaliSouth AfricanSouth AmericanSouth American IndianSoviet UnionSpaniardSpanishSpanish AmericanSpanish American IndianSri LankanSubsaharan AfricanSudaneseSwedishSwissSyrianTaiwaneseThaiTlingit-HaidaTohono O'OdhamTonganTrinidadian and TobagonianTsimshianTurkishU.S. Virgin IslanderUgandanUkrainianUruguayanUteVenezuelanVietnameseWelshWest IndianYakamaYaquiYugoslavianYumanYup'ikZimbabwean
Immigration
NonimmigrantsImmigrantsAfghanistanAfricaAlbaniaArgentinaArmeniaAsiaAustraliaAustriaBahamasBangladeshBarbadosBelarusBelgiumBelizeBoliviaBosnia and HerzegovinaBrazilBulgariaBurma/MyanmarCabo VerdeCambodiaCameroonCanadaCaribbeanCentral AmericaChileChinaColombiaCongoCosta RicaCroatiaCubaCzechoslovakiaDenmarkDominicaDominican RepublicEastern AfricaEastern AsiaEastern EuropeEcuadorEgyptEl SalvadorEnglandEritreaEthiopiaEuropeFijiFranceGermanyGhanaGreeceGrenadaGuatemalaGuyanaHaitiHondurasHong KongHungaryIndiaIndonesiaIranIraqIrelandIsraelItalyJamaicaJapanJordanKazakhstanKenyaKoreaKuwaitLaosLatin AmericaLatviaLebanonLiberiaLithuaniaMalaysiaMexicoMicronesiaMiddle AfricaMoldovaMoroccoNepalNetherlandsNicaraguaNigeriaNorth AmericaNorth MacedoniaNorthern AfricaNorthern EuropeNorwayOceaniaPakistanPanamaPeruPhilippinesPolandPortugalRomaniaRussiaSaudi ArabiaScotlandSenegalSerbiaSierra LeoneSingaporeSomaliaSouth AfricaSouth AmericaSouth Central AsiaSouth Eastern AsiaSouthern EuropeSpainSri LankaSt. Vincent and the GrenadinesSudanSwedenSwitzerlandSyriaTaiwanThailandTrinidad and TobagoTurkeyUgandaUkraineUruguayUzbekistanVenezuelaVietnamWest IndiesWestern AfricaWestern AsiaWestern EuropeYemenZaireZimbabweAzores
4th Grade
Income
Poverty
Unemployment
Labor Participation
Family Structure
Vehicle Availability
Education Level
Disability

4th Grade Comparison

Italians

Immigrants from Russia

Exceptional
Good
98.2%
4TH GRADE
100.0/ 100
METRIC RATING
35th/ 347
METRIC RANK
97.6%
4TH GRADE
67.0/ 100
METRIC RATING
154th/ 347
METRIC RANK

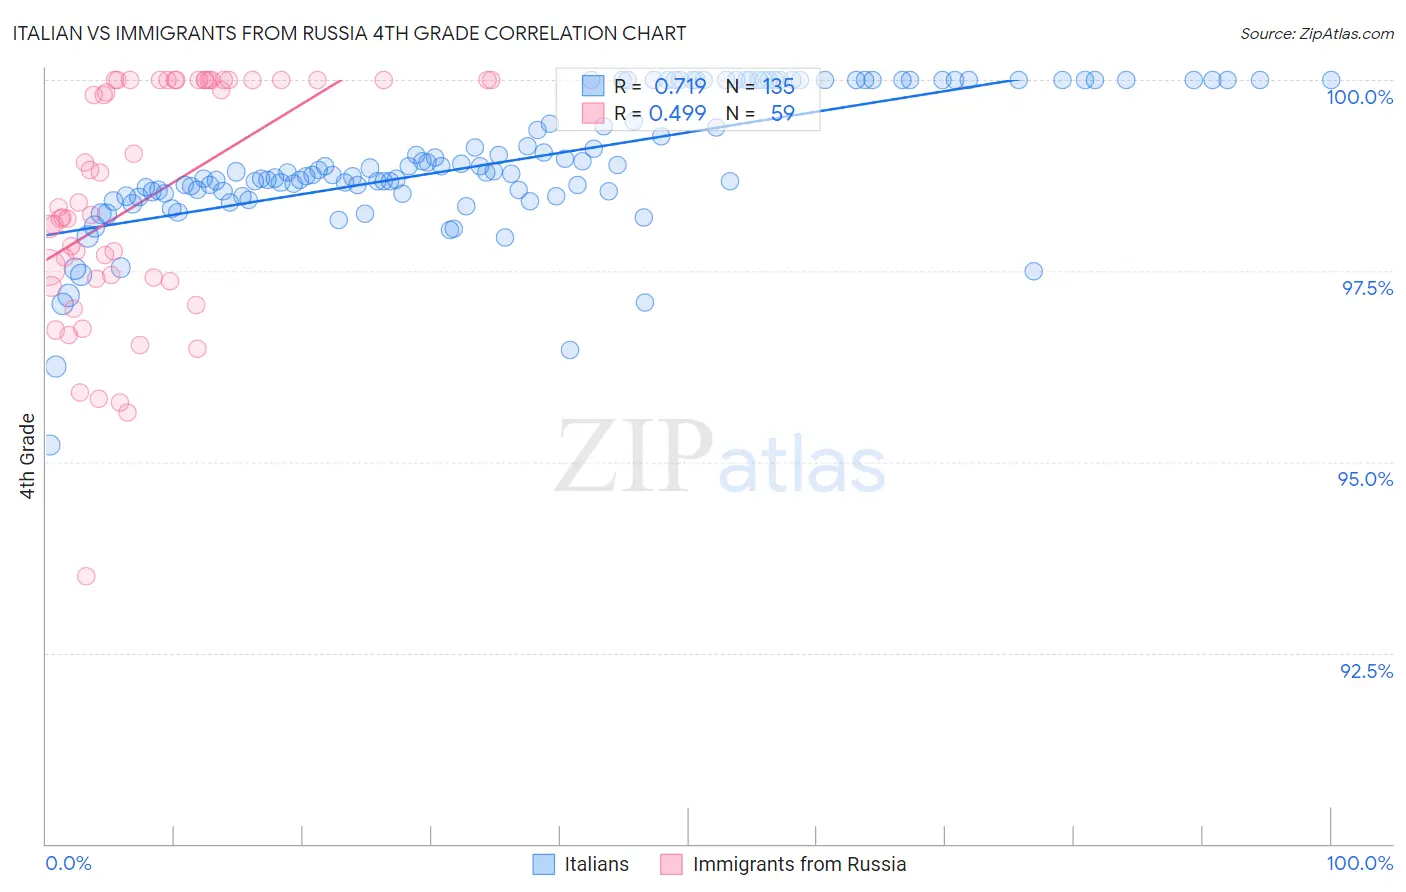
Italian vs Immigrants from Russia 4th Grade Correlation Chart

The statistical analysis conducted on geographies consisting of 575,115,824 people shows a strong positive correlation between the proportion of Italians and percentage of population with at least 4th grade education in the United States with a correlation coefficient (R) of 0.719 and weighted average of 98.2%. Similarly, the statistical analysis conducted on geographies consisting of 347,948,494 people shows a moderate positive correlation between the proportion of Immigrants from Russia and percentage of population with at least 4th grade education in the United States with a correlation coefficient (R) of 0.499 and weighted average of 97.6%, a difference of 0.66%.
Italian vs Immigrants from Russia 4th Grade

4th Grade Correlation Summary

MeasurementItalianImmigrants from Russia
Minimum95.2%93.5%
Maximum100.0%100.0%
Range4.8%6.5%
Mean98.9%98.4%
Median98.8%98.3%
Interquartile 25% (IQ1)98.5%97.4%
Interquartile 75% (IQ3)100.0%100.0%
Interquartile Range (IQR)1.5%2.6%
Standard Deviation (Sample)0.89%1.6%
Standard Deviation (Population)0.88%1.5%

Similar Demographics by 4th Grade

Demographics Similar to Italians by 4th Grade

In terms of 4th grade, the demographic groups most similar to Italians are Chippewa (98.2%, a difference of 0.0%), Swiss (98.2%, a difference of 0.010%), British (98.2%, a difference of 0.010%), Chinese (98.3%, a difference of 0.020%), and Latvian (98.2%, a difference of 0.030%).
DemographicsRating | Rank4th Grade
French
100.0
/100
|
#28
Exceptional
98.3%
Czechs
100.0
/100
|
#29
Exceptional
98.3%
Scandinavians
100.0
/100
|
#30
Exceptional
98.3%
Europeans
100.0
/100
|
#31
Exceptional
98.3%
Chinese
100.0
/100
|
#32
Exceptional
98.3%
Swiss
100.0
/100
|
#33
Exceptional
98.2%
Chippewa
100.0
/100
|
#34
Exceptional
98.2%
Italians
100.0
/100
|
#35
Exceptional
98.2%
British
100.0
/100
|
#36
Exceptional
98.2%
Latvians
99.9
/100
|
#37
Exceptional
98.2%
Aleuts
99.9
/100
|
#38
Exceptional
98.2%
Belgians
99.9
/100
|
#39
Exceptional
98.2%
Luxembourgers
99.9
/100
|
#40
Exceptional
98.2%
Eastern Europeans
99.9
/100
|
#41
Exceptional
98.2%
Hungarians
99.9
/100
|
#42
Exceptional
98.2%

Demographics Similar to Immigrants from Russia by 4th Grade

In terms of 4th grade, the demographic groups most similar to Immigrants from Russia are Albanian (97.6%, a difference of 0.0%), Immigrants from Jordan (97.6%, a difference of 0.0%), Immigrants from Bosnia and Herzegovina (97.6%, a difference of 0.0%), French American Indian (97.6%, a difference of 0.0%), and Immigrants from Italy (97.6%, a difference of 0.010%).
DemographicsRating | Rank4th Grade
Ute
80.6
/100
|
#147
Excellent
97.7%
Hopi
80.6
/100
|
#148
Excellent
97.7%
Soviet Union
77.8
/100
|
#149
Good
97.6%
Immigrants | Israel
77.7
/100
|
#150
Good
97.6%
Alsatians
77.2
/100
|
#151
Good
97.6%
Immigrants | South Central Asia
76.2
/100
|
#152
Good
97.6%
Immigrants | Eastern Europe
71.3
/100
|
#153
Good
97.6%
Immigrants | Russia
67.0
/100
|
#154
Good
97.6%
Albanians
67.0
/100
|
#155
Good
97.6%
Immigrants | Jordan
66.9
/100
|
#156
Good
97.6%
Immigrants | Bosnia and Herzegovina
66.0
/100
|
#157
Good
97.6%
French American Indians
65.9
/100
|
#158
Good
97.6%
Immigrants | Italy
63.7
/100
|
#159
Good
97.6%
Apache
61.3
/100
|
#160
Good
97.6%
Marshallese
60.8
/100
|
#161
Good
97.6%