Houma vs Immigrants from Panama Householder Income Under 25 years
COMPARE
Houma
Immigrants from Panama
Householder Income Under 25 years
Householder Income Under 25 years Comparison
Houma
Immigrants from Panama
$44,356
HOUSEHOLDER INCOME UNDER 25 YEARS
0.0/ 100
METRIC RATING
341st/ 347
METRIC RANK
$51,278
HOUSEHOLDER INCOME UNDER 25 YEARS
9.7/ 100
METRIC RATING
212th/ 347
METRIC RANK
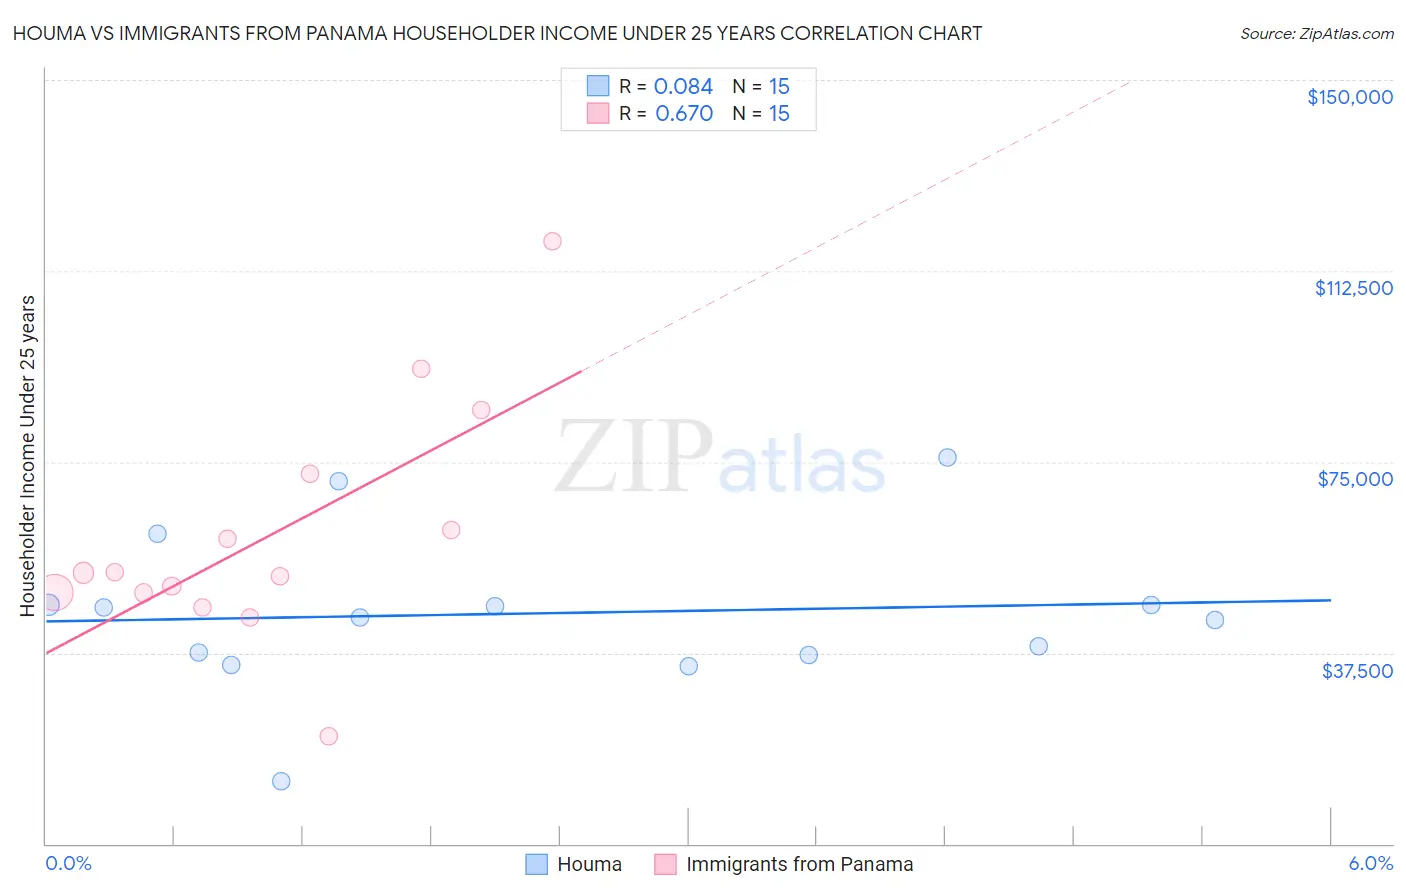
Houma vs Immigrants from Panama Householder Income Under 25 years Correlation Chart
The statistical analysis conducted on geographies consisting of 35,697,476 people shows a slight positive correlation between the proportion of Houma and household income with householder under the age of 25 in the United States with a correlation coefficient (R) of 0.084 and weighted average of $44,356. Similarly, the statistical analysis conducted on geographies consisting of 198,007,977 people shows a significant positive correlation between the proportion of Immigrants from Panama and household income with householder under the age of 25 in the United States with a correlation coefficient (R) of 0.670 and weighted average of $51,278, a difference of 15.6%.
Householder Income Under 25 years Correlation Summary
| Measurement | Houma | Immigrants from Panama |
| Minimum | $12,212 | $21,042 |
| Maximum | $75,747 | $118,375 |
| Range | $63,535 | $97,333 |
| Mean | $45,249 | $60,736 |
| Median | $44,434 | $53,162 |
| Interquartile 25% (IQ1) | $37,081 | $49,230 |
| Interquartile 75% (IQ3) | $46,891 | $72,697 |
| Interquartile Range (IQR) | $9,810 | $23,467 |
| Standard Deviation (Sample) | $15,434 | $23,474 |
| Standard Deviation (Population) | $14,910 | $22,678 |
Similar Demographics by Householder Income Under 25 years
Demographics Similar to Houma by Householder Income Under 25 years
In terms of householder income under 25 years, the demographic groups most similar to Houma are Black/African American ($44,381, a difference of 0.060%), Arapaho ($44,003, a difference of 0.80%), Kiowa ($44,733, a difference of 0.85%), Chickasaw ($44,763, a difference of 0.92%), and Pueblo ($45,018, a difference of 1.5%).
| Demographics | Rating | Rank | Householder Income Under 25 years |
| Creek | 0.0 /100 | #333 | Tragic $45,371 |
| Cajuns | 0.0 /100 | #334 | Tragic $45,338 |
| Cheyenne | 0.0 /100 | #335 | Tragic $45,275 |
| Tohono O'odham | 0.0 /100 | #336 | Tragic $45,248 |
| Pueblo | 0.0 /100 | #337 | Tragic $45,018 |
| Chickasaw | 0.0 /100 | #338 | Tragic $44,763 |
| Kiowa | 0.0 /100 | #339 | Tragic $44,733 |
| Blacks/African Americans | 0.0 /100 | #340 | Tragic $44,381 |
| Houma | 0.0 /100 | #341 | Tragic $44,356 |
| Arapaho | 0.0 /100 | #342 | Tragic $44,003 |
| Immigrants | Yemen | 0.0 /100 | #343 | Tragic $43,591 |
| Immigrants | Congo | 0.0 /100 | #344 | Tragic $43,266 |
| Navajo | 0.0 /100 | #345 | Tragic $42,380 |
| Puerto Ricans | 0.0 /100 | #346 | Tragic $39,726 |
| Lumbee | 0.0 /100 | #347 | Tragic $34,584 |
Demographics Similar to Immigrants from Panama by Householder Income Under 25 years
In terms of householder income under 25 years, the demographic groups most similar to Immigrants from Panama are Dutch ($51,265, a difference of 0.030%), Zimbabwean ($51,259, a difference of 0.040%), Icelander ($51,247, a difference of 0.060%), Irish ($51,317, a difference of 0.080%), and French ($51,230, a difference of 0.090%).
| Demographics | Rating | Rank | Householder Income Under 25 years |
| Cape Verdeans | 12.3 /100 | #205 | Poor $51,387 |
| Immigrants | Latin America | 12.3 /100 | #206 | Poor $51,387 |
| South Africans | 12.2 /100 | #207 | Poor $51,383 |
| Immigrants | Jordan | 11.9 /100 | #208 | Poor $51,370 |
| Syrians | 11.4 /100 | #209 | Poor $51,353 |
| Immigrants | Ghana | 10.9 /100 | #210 | Poor $51,333 |
| Irish | 10.6 /100 | #211 | Poor $51,317 |
| Immigrants | Panama | 9.7 /100 | #212 | Tragic $51,278 |
| Dutch | 9.4 /100 | #213 | Tragic $51,265 |
| Zimbabweans | 9.3 /100 | #214 | Tragic $51,259 |
| Icelanders | 9.1 /100 | #215 | Tragic $51,247 |
| French | 8.7 /100 | #216 | Tragic $51,230 |
| Czechoslovakians | 8.6 /100 | #217 | Tragic $51,224 |
| Immigrants | Belize | 8.6 /100 | #218 | Tragic $51,223 |
| Arabs | 8.5 /100 | #219 | Tragic $51,219 |