Immigrants from Poland vs Carpatho Rusyn 1st Grade
COMPARE
Immigrants from Poland
Carpatho Rusyn
1st Grade
1st Grade Comparison
Immigrants from Poland
Carpatho Rusyns
97.9%
1ST GRADE
40.1/ 100
METRIC RATING
184th/ 347
METRIC RANK
98.6%
1ST GRADE
100.0/ 100
METRIC RATING
13th/ 347
METRIC RANK
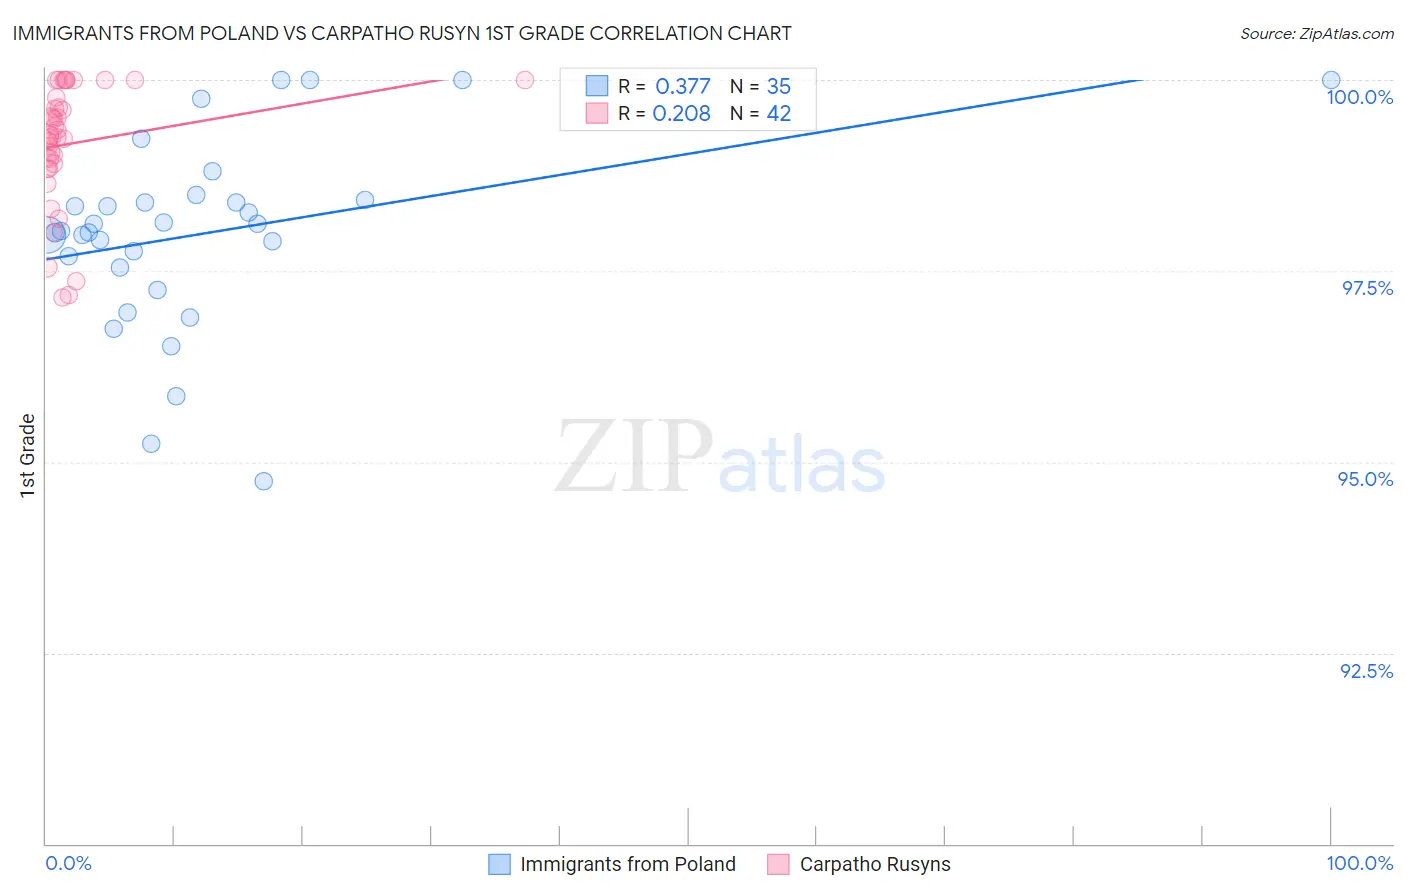
Immigrants from Poland vs Carpatho Rusyn 1st Grade Correlation Chart
The statistical analysis conducted on geographies consisting of 304,861,559 people shows a mild positive correlation between the proportion of Immigrants from Poland and percentage of population with at least 1st grade education in the United States with a correlation coefficient (R) of 0.377 and weighted average of 97.9%. Similarly, the statistical analysis conducted on geographies consisting of 58,871,690 people shows a weak positive correlation between the proportion of Carpatho Rusyns and percentage of population with at least 1st grade education in the United States with a correlation coefficient (R) of 0.208 and weighted average of 98.6%, a difference of 0.77%.
1st Grade Correlation Summary
| Measurement | Immigrants from Poland | Carpatho Rusyn |
| Minimum | 94.8% | 97.2% |
| Maximum | 100.0% | 100.0% |
| Range | 5.2% | 2.8% |
| Mean | 98.0% | 99.2% |
| Median | 98.0% | 99.3% |
| Interquartile 25% (IQ1) | 97.5% | 98.9% |
| Interquartile 75% (IQ3) | 98.4% | 99.8% |
| Interquartile Range (IQR) | 0.89% | 0.86% |
| Standard Deviation (Sample) | 1.2% | 0.80% |
| Standard Deviation (Population) | 1.2% | 0.79% |
Similar Demographics by 1st Grade
Demographics Similar to Immigrants from Poland by 1st Grade
In terms of 1st grade, the demographic groups most similar to Immigrants from Poland are Immigrants from Argentina (97.9%, a difference of 0.0%), Immigrants from Belarus (97.9%, a difference of 0.0%), Portuguese (97.9%, a difference of 0.010%), Egyptian (97.9%, a difference of 0.010%), and Paiute (97.9%, a difference of 0.010%).
| Demographics | Rating | Rank | 1st Grade |
| Immigrants | Brazil | 49.1 /100 | #177 | Average 97.9% |
| Immigrants | Venezuela | 47.8 /100 | #178 | Average 97.9% |
| Argentineans | 47.2 /100 | #179 | Average 97.9% |
| Immigrants | Bosnia and Herzegovina | 46.6 /100 | #180 | Average 97.9% |
| Portuguese | 44.2 /100 | #181 | Average 97.9% |
| Egyptians | 42.7 /100 | #182 | Average 97.9% |
| Immigrants | Argentina | 41.3 /100 | #183 | Average 97.9% |
| Immigrants | Poland | 40.1 /100 | #184 | Average 97.9% |
| Immigrants | Belarus | 39.3 /100 | #185 | Fair 97.9% |
| Paiute | 36.5 /100 | #186 | Fair 97.9% |
| Pakistanis | 35.8 /100 | #187 | Fair 97.9% |
| Arabs | 35.5 /100 | #188 | Fair 97.9% |
| Immigrants | Kazakhstan | 34.9 /100 | #189 | Fair 97.9% |
| Panamanians | 34.1 /100 | #190 | Fair 97.9% |
| Blacks/African Americans | 30.7 /100 | #191 | Fair 97.9% |
Demographics Similar to Carpatho Rusyns by 1st Grade
In terms of 1st grade, the demographic groups most similar to Carpatho Rusyns are English (98.6%, a difference of 0.0%), Slovene (98.7%, a difference of 0.010%), Swedish (98.6%, a difference of 0.010%), Tlingit-Haida (98.7%, a difference of 0.020%), and Aleut (98.6%, a difference of 0.030%).
| Demographics | Rating | Rank | 1st Grade |
| Alaskan Athabascans | 100.0 /100 | #6 | Exceptional 98.8% |
| Alaska Natives | 100.0 /100 | #7 | Exceptional 98.7% |
| Norwegians | 100.0 /100 | #8 | Exceptional 98.7% |
| Slovaks | 100.0 /100 | #9 | Exceptional 98.7% |
| Germans | 100.0 /100 | #10 | Exceptional 98.7% |
| Tlingit-Haida | 100.0 /100 | #11 | Exceptional 98.7% |
| Slovenes | 100.0 /100 | #12 | Exceptional 98.7% |
| Carpatho Rusyns | 100.0 /100 | #13 | Exceptional 98.6% |
| English | 100.0 /100 | #14 | Exceptional 98.6% |
| Swedes | 100.0 /100 | #15 | Exceptional 98.6% |
| Aleuts | 100.0 /100 | #16 | Exceptional 98.6% |
| Scottish | 100.0 /100 | #17 | Exceptional 98.6% |
| Dutch | 100.0 /100 | #18 | Exceptional 98.6% |
| Irish | 100.0 /100 | #19 | Exceptional 98.6% |
| Sioux | 100.0 /100 | #20 | Exceptional 98.6% |