Immigrants from Sierra Leone vs Carpatho Rusyn 1st Grade
COMPARE
Immigrants from Sierra Leone
Carpatho Rusyn
1st Grade
1st Grade Comparison
Immigrants from Sierra Leone
Carpatho Rusyns
97.5%
1ST GRADE
0.3/ 100
METRIC RATING
267th/ 347
METRIC RANK
98.6%
1ST GRADE
100.0/ 100
METRIC RATING
13th/ 347
METRIC RANK
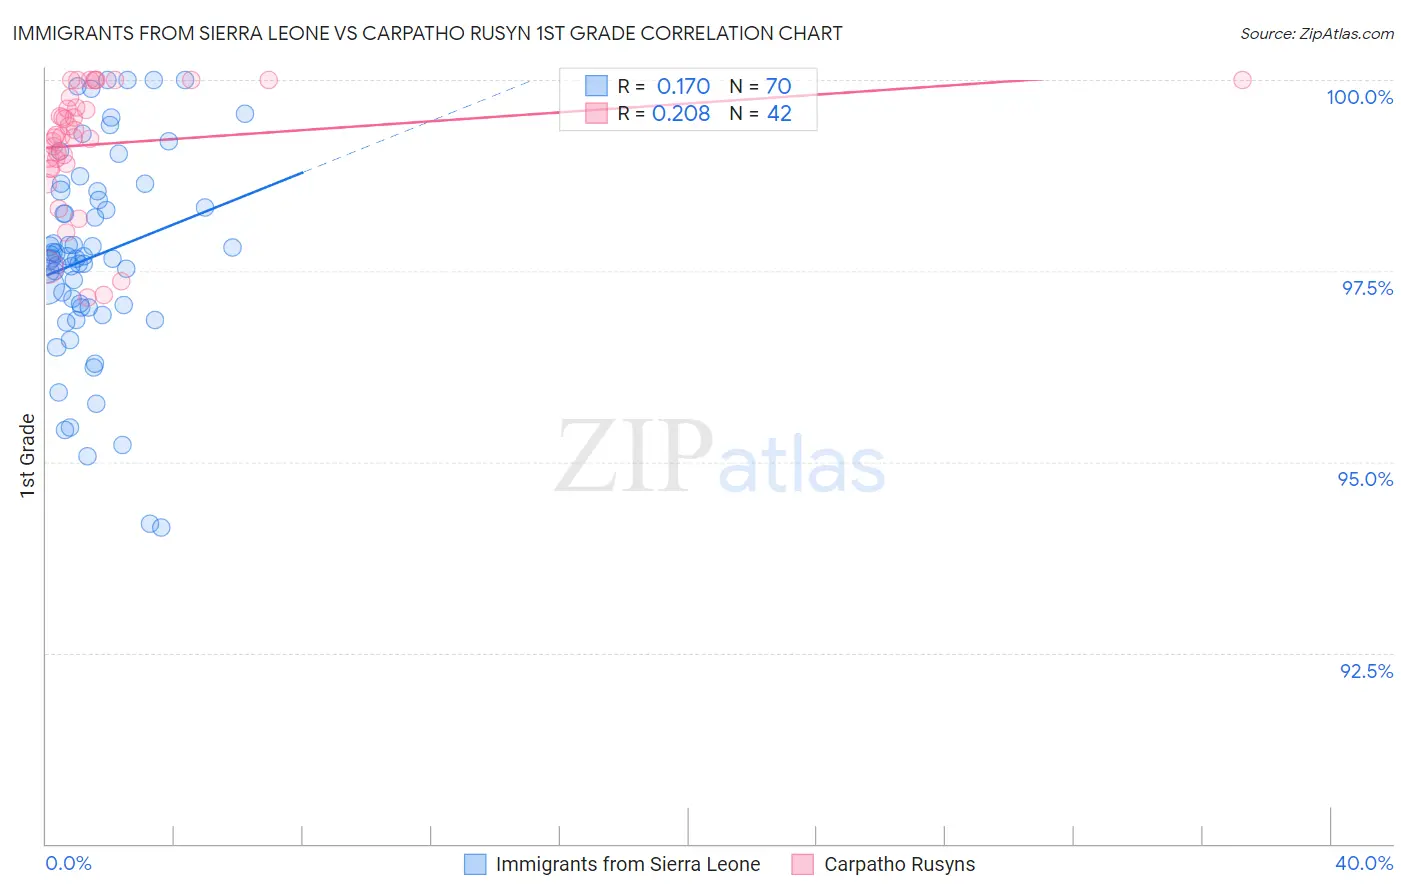
Immigrants from Sierra Leone vs Carpatho Rusyn 1st Grade Correlation Chart
The statistical analysis conducted on geographies consisting of 101,634,956 people shows a poor positive correlation between the proportion of Immigrants from Sierra Leone and percentage of population with at least 1st grade education in the United States with a correlation coefficient (R) of 0.170 and weighted average of 97.5%. Similarly, the statistical analysis conducted on geographies consisting of 58,871,690 people shows a weak positive correlation between the proportion of Carpatho Rusyns and percentage of population with at least 1st grade education in the United States with a correlation coefficient (R) of 0.208 and weighted average of 98.6%, a difference of 1.2%.
1st Grade Correlation Summary
| Measurement | Immigrants from Sierra Leone | Carpatho Rusyn |
| Minimum | 94.1% | 97.2% |
| Maximum | 100.0% | 100.0% |
| Range | 5.9% | 2.8% |
| Mean | 97.7% | 99.2% |
| Median | 97.7% | 99.3% |
| Interquartile 25% (IQ1) | 97.0% | 98.9% |
| Interquartile 75% (IQ3) | 98.5% | 99.8% |
| Interquartile Range (IQR) | 1.5% | 0.86% |
| Standard Deviation (Sample) | 1.3% | 0.80% |
| Standard Deviation (Population) | 1.3% | 0.79% |
Similar Demographics by 1st Grade
Demographics Similar to Immigrants from Sierra Leone by 1st Grade
In terms of 1st grade, the demographic groups most similar to Immigrants from Sierra Leone are Cuban (97.5%, a difference of 0.0%), Immigrants from Liberia (97.5%, a difference of 0.0%), Taiwanese (97.5%, a difference of 0.010%), Immigrants from Nigeria (97.5%, a difference of 0.010%), and West Indian (97.5%, a difference of 0.010%).
| Demographics | Rating | Rank | 1st Grade |
| Armenians | 0.5 /100 | #260 | Tragic 97.5% |
| Immigrants | Ethiopia | 0.4 /100 | #261 | Tragic 97.5% |
| Assyrians/Chaldeans/Syriacs | 0.4 /100 | #262 | Tragic 97.5% |
| Immigrants | South America | 0.4 /100 | #263 | Tragic 97.5% |
| Taiwanese | 0.4 /100 | #264 | Tragic 97.5% |
| Cubans | 0.3 /100 | #265 | Tragic 97.5% |
| Immigrants | Liberia | 0.3 /100 | #266 | Tragic 97.5% |
| Immigrants | Sierra Leone | 0.3 /100 | #267 | Tragic 97.5% |
| Immigrants | Nigeria | 0.3 /100 | #268 | Tragic 97.5% |
| West Indians | 0.3 /100 | #269 | Tragic 97.5% |
| Immigrants | Jamaica | 0.2 /100 | #270 | Tragic 97.5% |
| Immigrants | Cameroon | 0.2 /100 | #271 | Tragic 97.4% |
| Immigrants | Peru | 0.2 /100 | #272 | Tragic 97.4% |
| Immigrants | Bolivia | 0.2 /100 | #273 | Tragic 97.4% |
| Ghanaians | 0.1 /100 | #274 | Tragic 97.4% |
Demographics Similar to Carpatho Rusyns by 1st Grade
In terms of 1st grade, the demographic groups most similar to Carpatho Rusyns are English (98.6%, a difference of 0.0%), Slovene (98.7%, a difference of 0.010%), Swedish (98.6%, a difference of 0.010%), Tlingit-Haida (98.7%, a difference of 0.020%), and Aleut (98.6%, a difference of 0.030%).
| Demographics | Rating | Rank | 1st Grade |
| Alaskan Athabascans | 100.0 /100 | #6 | Exceptional 98.8% |
| Alaska Natives | 100.0 /100 | #7 | Exceptional 98.7% |
| Norwegians | 100.0 /100 | #8 | Exceptional 98.7% |
| Slovaks | 100.0 /100 | #9 | Exceptional 98.7% |
| Germans | 100.0 /100 | #10 | Exceptional 98.7% |
| Tlingit-Haida | 100.0 /100 | #11 | Exceptional 98.7% |
| Slovenes | 100.0 /100 | #12 | Exceptional 98.7% |
| Carpatho Rusyns | 100.0 /100 | #13 | Exceptional 98.6% |
| English | 100.0 /100 | #14 | Exceptional 98.6% |
| Swedes | 100.0 /100 | #15 | Exceptional 98.6% |
| Aleuts | 100.0 /100 | #16 | Exceptional 98.6% |
| Scottish | 100.0 /100 | #17 | Exceptional 98.6% |
| Dutch | 100.0 /100 | #18 | Exceptional 98.6% |
| Irish | 100.0 /100 | #19 | Exceptional 98.6% |
| Sioux | 100.0 /100 | #20 | Exceptional 98.6% |