Native Hawaiian vs Osage Master's Degree
COMPARE
Native Hawaiian
Osage
Master's Degree
Master's Degree Comparison
Native Hawaiians
Osage
12.3%
MASTER'S DEGREE
0.4/ 100
METRIC RATING
268th/ 347
METRIC RANK
12.6%
MASTER'S DEGREE
0.7/ 100
METRIC RATING
257th/ 347
METRIC RANK
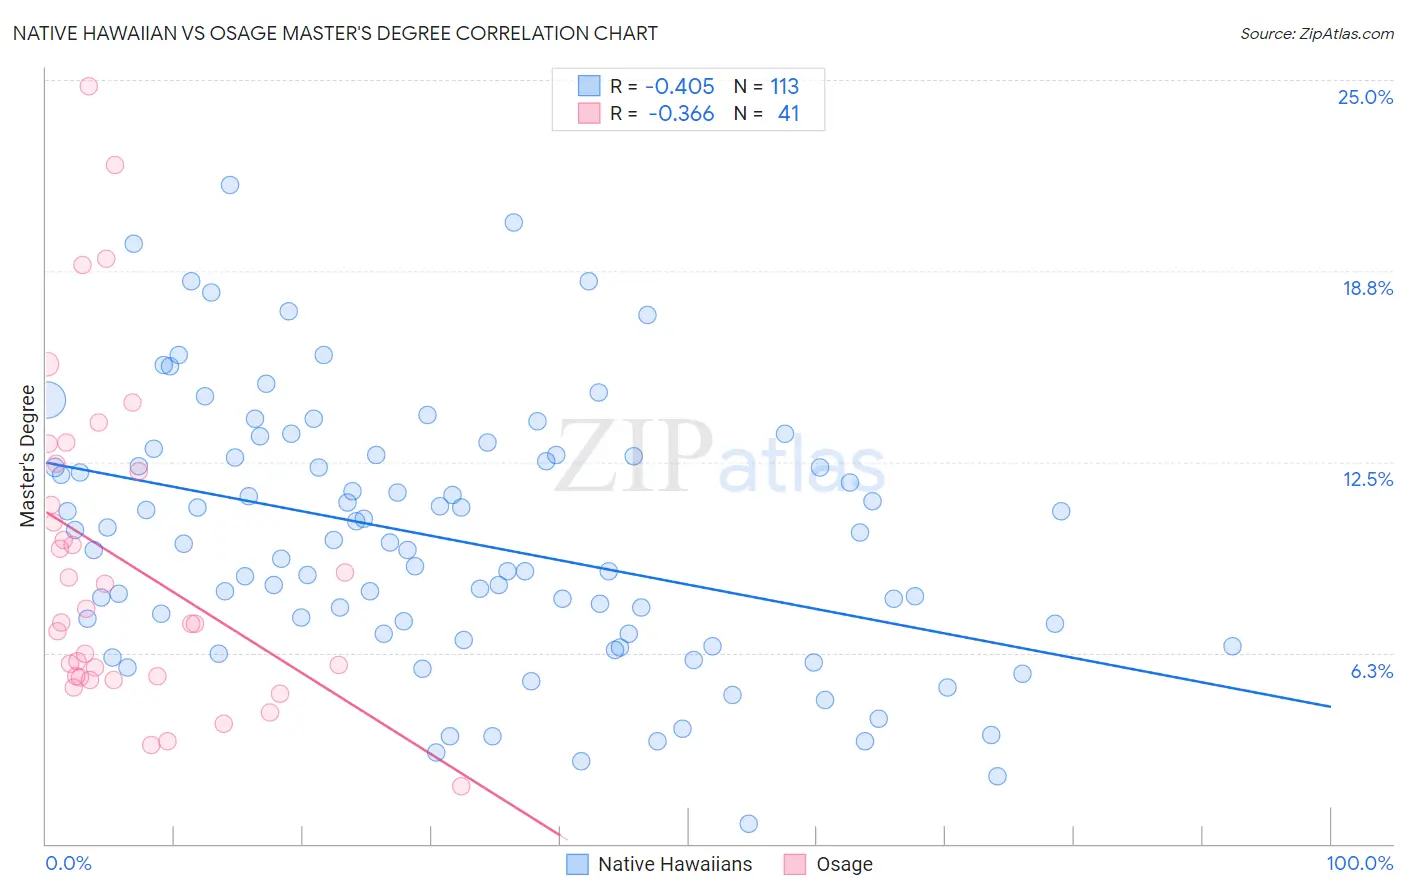
Native Hawaiian vs Osage Master's Degree Correlation Chart
The statistical analysis conducted on geographies consisting of 331,993,675 people shows a moderate negative correlation between the proportion of Native Hawaiians and percentage of population with at least master's degree education in the United States with a correlation coefficient (R) of -0.405 and weighted average of 12.3%. Similarly, the statistical analysis conducted on geographies consisting of 91,790,824 people shows a mild negative correlation between the proportion of Osage and percentage of population with at least master's degree education in the United States with a correlation coefficient (R) of -0.366 and weighted average of 12.6%, a difference of 2.4%.
Master's Degree Correlation Summary
| Measurement | Native Hawaiian | Osage |
| Minimum | 0.67% | 1.9% |
| Maximum | 21.6% | 24.8% |
| Range | 20.9% | 22.9% |
| Mean | 10.0% | 9.2% |
| Median | 9.8% | 7.2% |
| Interquartile 25% (IQ1) | 6.9% | 5.5% |
| Interquartile 75% (IQ3) | 12.7% | 12.3% |
| Interquartile Range (IQR) | 5.8% | 6.9% |
| Standard Deviation (Sample) | 4.2% | 5.3% |
| Standard Deviation (Population) | 4.2% | 5.2% |
Demographics Similar to Native Hawaiians and Osage by Master's Degree
In terms of master's degree, the demographic groups most similar to Native Hawaiians are American (12.3%, a difference of 0.25%), Central American (12.2%, a difference of 0.65%), Salvadoran (12.2%, a difference of 0.78%), Bahamian (12.4%, a difference of 1.0%), and Immigrants from Fiji (12.4%, a difference of 1.2%). Similarly, the demographic groups most similar to Osage are Immigrants from Portugal (12.6%, a difference of 0.48%), Immigrants from Liberia (12.5%, a difference of 0.50%), Immigrants from Congo (12.6%, a difference of 0.55%), Indonesian (12.6%, a difference of 0.58%), and Japanese (12.5%, a difference of 0.59%).
| Demographics | Rating | Rank | Master's Degree |
| French American Indians | 1.0 /100 | #252 | Tragic 12.7% |
| Immigrants | Dominica | 0.8 /100 | #253 | Tragic 12.6% |
| Indonesians | 0.8 /100 | #254 | Tragic 12.6% |
| Immigrants | Congo | 0.8 /100 | #255 | Tragic 12.6% |
| Immigrants | Portugal | 0.8 /100 | #256 | Tragic 12.6% |
| Osage | 0.7 /100 | #257 | Tragic 12.6% |
| Immigrants | Liberia | 0.6 /100 | #258 | Tragic 12.5% |
| Japanese | 0.6 /100 | #259 | Tragic 12.5% |
| Dominicans | 0.6 /100 | #260 | Tragic 12.5% |
| Tongans | 0.6 /100 | #261 | Tragic 12.5% |
| Nicaraguans | 0.6 /100 | #262 | Tragic 12.5% |
| Central American Indians | 0.5 /100 | #263 | Tragic 12.4% |
| Belizeans | 0.5 /100 | #264 | Tragic 12.4% |
| Immigrants | Fiji | 0.5 /100 | #265 | Tragic 12.4% |
| Bahamians | 0.5 /100 | #266 | Tragic 12.4% |
| Americans | 0.4 /100 | #267 | Tragic 12.3% |
| Native Hawaiians | 0.4 /100 | #268 | Tragic 12.3% |
| Central Americans | 0.3 /100 | #269 | Tragic 12.2% |
| Salvadorans | 0.3 /100 | #270 | Tragic 12.2% |
| Haitians | 0.3 /100 | #271 | Tragic 12.1% |
| Comanche | 0.3 /100 | #272 | Tragic 12.1% |