Delaware vs Immigrants from Caribbean 7th Grade
COMPARE
Delaware
Immigrants from Caribbean
7th Grade
7th Grade Comparison
Delaware
Immigrants from Caribbean
96.8%
7TH GRADE
99.2/ 100
METRIC RATING
81st/ 347
METRIC RANK
94.0%
7TH GRADE
0.0/ 100
METRIC RATING
310th/ 347
METRIC RANK
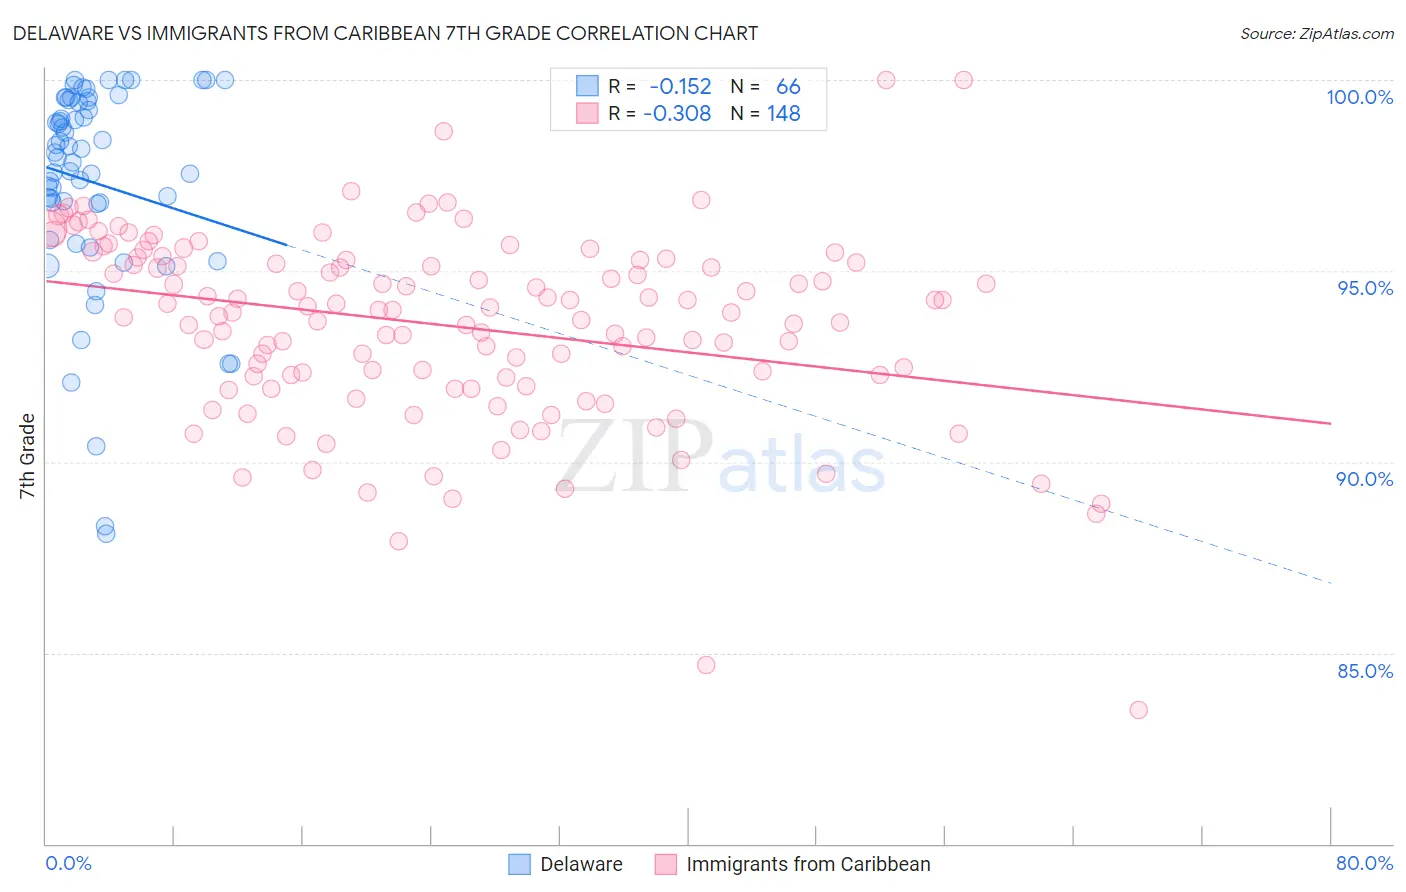
Delaware vs Immigrants from Caribbean 7th Grade Correlation Chart
The statistical analysis conducted on geographies consisting of 96,234,659 people shows a poor negative correlation between the proportion of Delaware and percentage of population with at least 7th grade education in the United States with a correlation coefficient (R) of -0.152 and weighted average of 96.8%. Similarly, the statistical analysis conducted on geographies consisting of 450,064,731 people shows a mild negative correlation between the proportion of Immigrants from Caribbean and percentage of population with at least 7th grade education in the United States with a correlation coefficient (R) of -0.308 and weighted average of 94.0%, a difference of 2.9%.
7th Grade Correlation Summary
| Measurement | Delaware | Immigrants from Caribbean |
| Minimum | 88.1% | 83.5% |
| Maximum | 100.0% | 100.0% |
| Range | 11.9% | 16.5% |
| Mean | 97.3% | 93.6% |
| Median | 98.0% | 93.9% |
| Interquartile 25% (IQ1) | 96.8% | 92.2% |
| Interquartile 75% (IQ3) | 99.4% | 95.3% |
| Interquartile Range (IQR) | 2.7% | 3.1% |
| Standard Deviation (Sample) | 2.7% | 2.5% |
| Standard Deviation (Population) | 2.7% | 2.5% |
Similar Demographics by 7th Grade
Demographics Similar to Delaware by 7th Grade
In terms of 7th grade, the demographic groups most similar to Delaware are Chickasaw (96.7%, a difference of 0.010%), Icelander (96.7%, a difference of 0.010%), Immigrants from Netherlands (96.8%, a difference of 0.020%), Cypriot (96.8%, a difference of 0.020%), and Yugoslavian (96.8%, a difference of 0.020%).
| Demographics | Rating | Rank | 7th Grade |
| Immigrants | England | 99.5 /100 | #74 | Exceptional 96.8% |
| Zimbabweans | 99.5 /100 | #75 | Exceptional 96.8% |
| Immigrants | Ireland | 99.4 /100 | #76 | Exceptional 96.8% |
| Cherokee | 99.4 /100 | #77 | Exceptional 96.8% |
| Immigrants | Netherlands | 99.3 /100 | #78 | Exceptional 96.8% |
| Cypriots | 99.3 /100 | #79 | Exceptional 96.8% |
| Yugoslavians | 99.3 /100 | #80 | Exceptional 96.8% |
| Delaware | 99.2 /100 | #81 | Exceptional 96.8% |
| Chickasaw | 99.2 /100 | #82 | Exceptional 96.7% |
| Icelanders | 99.1 /100 | #83 | Exceptional 96.7% |
| Romanians | 99.1 /100 | #84 | Exceptional 96.7% |
| Kiowa | 99.1 /100 | #85 | Exceptional 96.7% |
| Turks | 99.1 /100 | #86 | Exceptional 96.7% |
| Immigrants | Belgium | 99.0 /100 | #87 | Exceptional 96.7% |
| Puget Sound Salish | 99.0 /100 | #88 | Exceptional 96.7% |
Demographics Similar to Immigrants from Caribbean by 7th Grade
In terms of 7th grade, the demographic groups most similar to Immigrants from Caribbean are Ecuadorian (94.0%, a difference of 0.010%), Puerto Rican (94.0%, a difference of 0.010%), Immigrants (94.0%, a difference of 0.050%), Immigrants from Bangladesh (94.0%, a difference of 0.050%), and Cape Verdean (94.1%, a difference of 0.070%).
| Demographics | Rating | Rank | 7th Grade |
| Sri Lankans | 0.0 /100 | #303 | Tragic 94.4% |
| Immigrants | Haiti | 0.0 /100 | #304 | Tragic 94.3% |
| Guyanese | 0.0 /100 | #305 | Tragic 94.3% |
| Immigrants | Guyana | 0.0 /100 | #306 | Tragic 94.2% |
| Immigrants | Portugal | 0.0 /100 | #307 | Tragic 94.2% |
| Cape Verdeans | 0.0 /100 | #308 | Tragic 94.1% |
| Ecuadorians | 0.0 /100 | #309 | Tragic 94.0% |
| Immigrants | Caribbean | 0.0 /100 | #310 | Tragic 94.0% |
| Puerto Ricans | 0.0 /100 | #311 | Tragic 94.0% |
| Immigrants | Immigrants | 0.0 /100 | #312 | Tragic 94.0% |
| Immigrants | Bangladesh | 0.0 /100 | #313 | Tragic 94.0% |
| Japanese | 0.0 /100 | #314 | Tragic 94.0% |
| Vietnamese | 0.0 /100 | #315 | Tragic 93.9% |
| Immigrants | Vietnam | 0.0 /100 | #316 | Tragic 93.9% |
| Immigrants | Cuba | 0.0 /100 | #317 | Tragic 93.8% |