Romanian vs Cajun College, Under 1 year
COMPARE
Romanian
Cajun
College, Under 1 year
College, Under 1 year Comparison
Romanians
Cajuns
68.2%
COLLEGE, UNDER 1 YEAR
97.9/ 100
METRIC RATING
93rd/ 347
METRIC RANK
57.3%
COLLEGE, UNDER 1 YEAR
0.0/ 100
METRIC RATING
311th/ 347
METRIC RANK
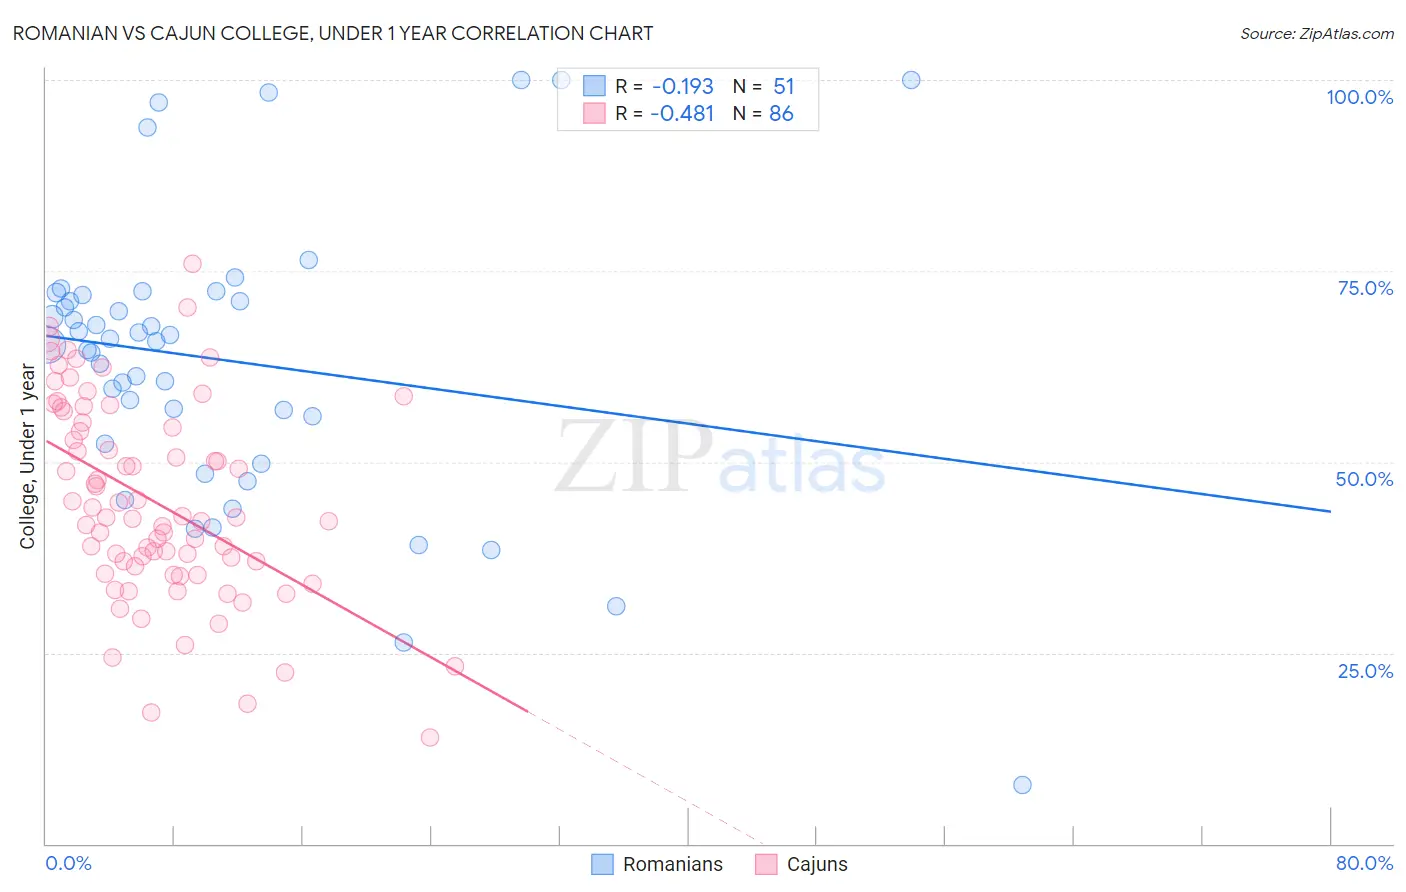
Romanian vs Cajun College, Under 1 year Correlation Chart
The statistical analysis conducted on geographies consisting of 377,903,335 people shows a poor negative correlation between the proportion of Romanians and percentage of population with at least college, under 1 year education in the United States with a correlation coefficient (R) of -0.193 and weighted average of 68.2%. Similarly, the statistical analysis conducted on geographies consisting of 149,713,149 people shows a moderate negative correlation between the proportion of Cajuns and percentage of population with at least college, under 1 year education in the United States with a correlation coefficient (R) of -0.481 and weighted average of 57.3%, a difference of 18.9%.
College, Under 1 year Correlation Summary
| Measurement | Romanian | Cajun |
| Minimum | 7.6% | 13.9% |
| Maximum | 100.0% | 75.9% |
| Range | 92.4% | 62.0% |
| Mean | 63.3% | 44.8% |
| Median | 65.8% | 42.7% |
| Interquartile 25% (IQ1) | 52.4% | 36.3% |
| Interquartile 75% (IQ3) | 71.8% | 55.2% |
| Interquartile Range (IQR) | 19.5% | 18.9% |
| Standard Deviation (Sample) | 18.8% | 13.0% |
| Standard Deviation (Population) | 18.7% | 12.9% |
Similar Demographics by College, Under 1 year
Demographics Similar to Romanians by College, Under 1 year
In terms of college, under 1 year, the demographic groups most similar to Romanians are Luxembourger (68.2%, a difference of 0.090%), Armenian (68.1%, a difference of 0.090%), European (68.2%, a difference of 0.10%), Icelander (68.3%, a difference of 0.13%), and Ethiopian (68.3%, a difference of 0.19%).
| Demographics | Rating | Rank | College, Under 1 year |
| Immigrants | Lebanon | 98.3 /100 | #86 | Exceptional 68.3% |
| Chinese | 98.3 /100 | #87 | Exceptional 68.3% |
| Croatians | 98.2 /100 | #88 | Exceptional 68.3% |
| Ethiopians | 98.2 /100 | #89 | Exceptional 68.3% |
| Icelanders | 98.1 /100 | #90 | Exceptional 68.3% |
| Europeans | 98.1 /100 | #91 | Exceptional 68.2% |
| Luxembourgers | 98.1 /100 | #92 | Exceptional 68.2% |
| Romanians | 97.9 /100 | #93 | Exceptional 68.2% |
| Armenians | 97.7 /100 | #94 | Exceptional 68.1% |
| Immigrants | Pakistan | 97.5 /100 | #95 | Exceptional 68.0% |
| Jordanians | 97.4 /100 | #96 | Exceptional 68.0% |
| Immigrants | Ethiopia | 97.3 /100 | #97 | Exceptional 68.0% |
| Paraguayans | 97.1 /100 | #98 | Exceptional 67.9% |
| Immigrants | Bolivia | 97.0 /100 | #99 | Exceptional 67.9% |
| Immigrants | Argentina | 97.0 /100 | #100 | Exceptional 67.9% |
Demographics Similar to Cajuns by College, Under 1 year
In terms of college, under 1 year, the demographic groups most similar to Cajuns are Pueblo (57.4%, a difference of 0.060%), Salvadoran (57.3%, a difference of 0.070%), Dutch West Indian (57.2%, a difference of 0.31%), Hopi (57.1%, a difference of 0.42%), and Immigrants from Nicaragua (57.6%, a difference of 0.45%).
| Demographics | Rating | Rank | College, Under 1 year |
| Kiowa | 0.0 /100 | #304 | Tragic 57.8% |
| Haitians | 0.0 /100 | #305 | Tragic 57.8% |
| Immigrants | Portugal | 0.0 /100 | #306 | Tragic 57.7% |
| Fijians | 0.0 /100 | #307 | Tragic 57.7% |
| Central Americans | 0.0 /100 | #308 | Tragic 57.7% |
| Immigrants | Nicaragua | 0.0 /100 | #309 | Tragic 57.6% |
| Pueblo | 0.0 /100 | #310 | Tragic 57.4% |
| Cajuns | 0.0 /100 | #311 | Tragic 57.3% |
| Salvadorans | 0.0 /100 | #312 | Tragic 57.3% |
| Dutch West Indians | 0.0 /100 | #313 | Tragic 57.2% |
| Hopi | 0.0 /100 | #314 | Tragic 57.1% |
| Hondurans | 0.0 /100 | #315 | Tragic 57.1% |
| Menominee | 0.0 /100 | #316 | Tragic 57.0% |
| Hispanics or Latinos | 0.0 /100 | #317 | Tragic 57.0% |
| Immigrants | Haiti | 0.0 /100 | #318 | Tragic 56.9% |