German Russian vs Ukrainian Master's Degree
COMPARE
German Russian
Ukrainian
Master's Degree
Master's Degree Comparison
German Russians
Ukrainians
13.5%
MASTER'S DEGREE
4.5/ 100
METRIC RATING
235th/ 347
METRIC RANK
16.9%
MASTER'S DEGREE
98.3/ 100
METRIC RATING
104th/ 347
METRIC RANK
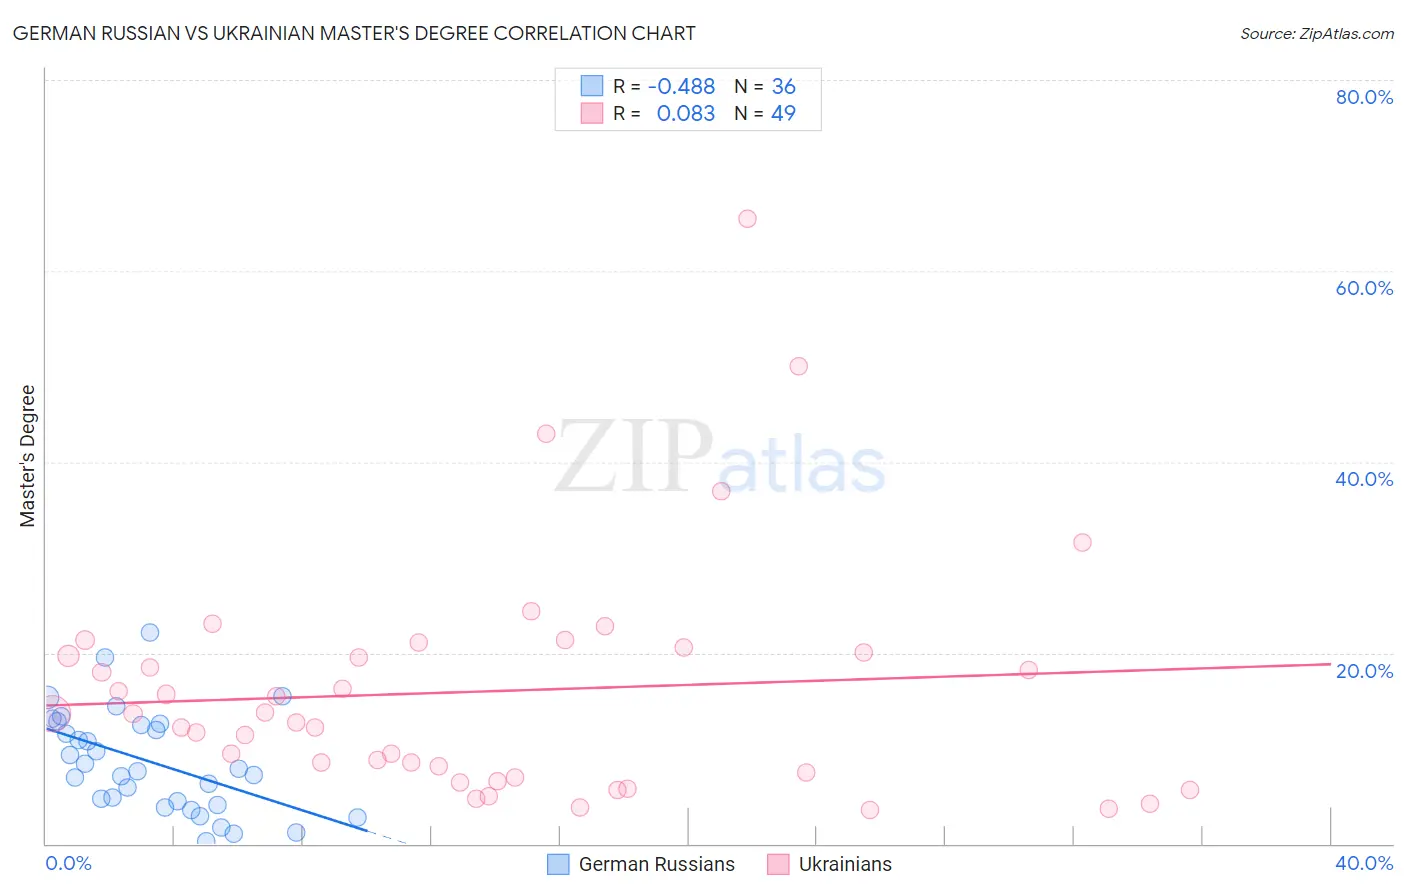
German Russian vs Ukrainian Master's Degree Correlation Chart
The statistical analysis conducted on geographies consisting of 96,446,864 people shows a moderate negative correlation between the proportion of German Russians and percentage of population with at least master's degree education in the United States with a correlation coefficient (R) of -0.488 and weighted average of 13.5%. Similarly, the statistical analysis conducted on geographies consisting of 448,518,691 people shows a slight positive correlation between the proportion of Ukrainians and percentage of population with at least master's degree education in the United States with a correlation coefficient (R) of 0.083 and weighted average of 16.9%, a difference of 25.3%.
Master's Degree Correlation Summary
| Measurement | German Russian | Ukrainian |
| Minimum | 0.22% | 3.6% |
| Maximum | 22.1% | 65.5% |
| Range | 21.9% | 61.9% |
| Mean | 8.5% | 16.0% |
| Median | 7.8% | 13.6% |
| Interquartile 25% (IQ1) | 4.3% | 7.2% |
| Interquartile 75% (IQ3) | 12.5% | 20.3% |
| Interquartile Range (IQR) | 8.3% | 13.1% |
| Standard Deviation (Sample) | 5.3% | 12.3% |
| Standard Deviation (Population) | 5.2% | 12.2% |
Similar Demographics by Master's Degree
Demographics Similar to German Russians by Master's Degree
In terms of master's degree, the demographic groups most similar to German Russians are Immigrants from Guyana (13.4%, a difference of 0.11%), Jamaican (13.4%, a difference of 0.34%), Immigrants from Burma/Myanmar (13.5%, a difference of 0.41%), Hmong (13.4%, a difference of 0.48%), and Immigrants from Ecuador (13.6%, a difference of 0.91%).
| Demographics | Rating | Rank | Master's Degree |
| Whites/Caucasians | 9.1 /100 | #228 | Tragic 13.8% |
| British West Indians | 8.8 /100 | #229 | Tragic 13.8% |
| Dutch | 8.7 /100 | #230 | Tragic 13.8% |
| Guyanese | 7.6 /100 | #231 | Tragic 13.7% |
| Immigrants | Philippines | 6.0 /100 | #232 | Tragic 13.6% |
| Immigrants | Ecuador | 5.7 /100 | #233 | Tragic 13.6% |
| Immigrants | Burma/Myanmar | 5.0 /100 | #234 | Tragic 13.5% |
| German Russians | 4.5 /100 | #235 | Tragic 13.5% |
| Immigrants | Guyana | 4.4 /100 | #236 | Tragic 13.4% |
| Jamaicans | 4.1 /100 | #237 | Tragic 13.4% |
| Hmong | 4.0 /100 | #238 | Tragic 13.4% |
| Immigrants | Nonimmigrants | 3.4 /100 | #239 | Tragic 13.3% |
| Guamanians/Chamorros | 2.2 /100 | #240 | Tragic 13.1% |
| U.S. Virgin Islanders | 2.1 /100 | #241 | Tragic 13.1% |
| Spanish Americans | 1.9 /100 | #242 | Tragic 13.0% |
Demographics Similar to Ukrainians by Master's Degree
In terms of master's degree, the demographic groups most similar to Ukrainians are Syrian (16.8%, a difference of 0.10%), Alsatian (16.9%, a difference of 0.12%), Immigrants from Albania (16.8%, a difference of 0.38%), Chilean (16.9%, a difference of 0.45%), and Armenian (16.8%, a difference of 0.47%).
| Demographics | Rating | Rank | Master's Degree |
| Immigrants | England | 98.8 /100 | #97 | Exceptional 17.0% |
| Immigrants | Ukraine | 98.8 /100 | #98 | Exceptional 17.0% |
| Laotians | 98.8 /100 | #99 | Exceptional 17.0% |
| Albanians | 98.7 /100 | #100 | Exceptional 17.0% |
| Immigrants | Nepal | 98.6 /100 | #101 | Exceptional 17.0% |
| Chileans | 98.6 /100 | #102 | Exceptional 16.9% |
| Alsatians | 98.4 /100 | #103 | Exceptional 16.9% |
| Ukrainians | 98.3 /100 | #104 | Exceptional 16.9% |
| Syrians | 98.3 /100 | #105 | Exceptional 16.8% |
| Immigrants | Albania | 98.1 /100 | #106 | Exceptional 16.8% |
| Armenians | 98.0 /100 | #107 | Exceptional 16.8% |
| Sierra Leoneans | 98.0 /100 | #108 | Exceptional 16.8% |
| Moroccans | 98.0 /100 | #109 | Exceptional 16.8% |
| Immigrants | Chile | 98.0 /100 | #110 | Exceptional 16.8% |
| Austrians | 97.8 /100 | #111 | Exceptional 16.7% |