Slovene vs Immigrants from West Indies 7th Grade
COMPARE
Slovene
Immigrants from West Indies
7th Grade
7th Grade Comparison
Slovenes
Immigrants from West Indies
97.6%
7TH GRADE
100.0/ 100
METRIC RATING
10th/ 347
METRIC RANK
94.8%
7TH GRADE
0.0/ 100
METRIC RATING
292nd/ 347
METRIC RANK
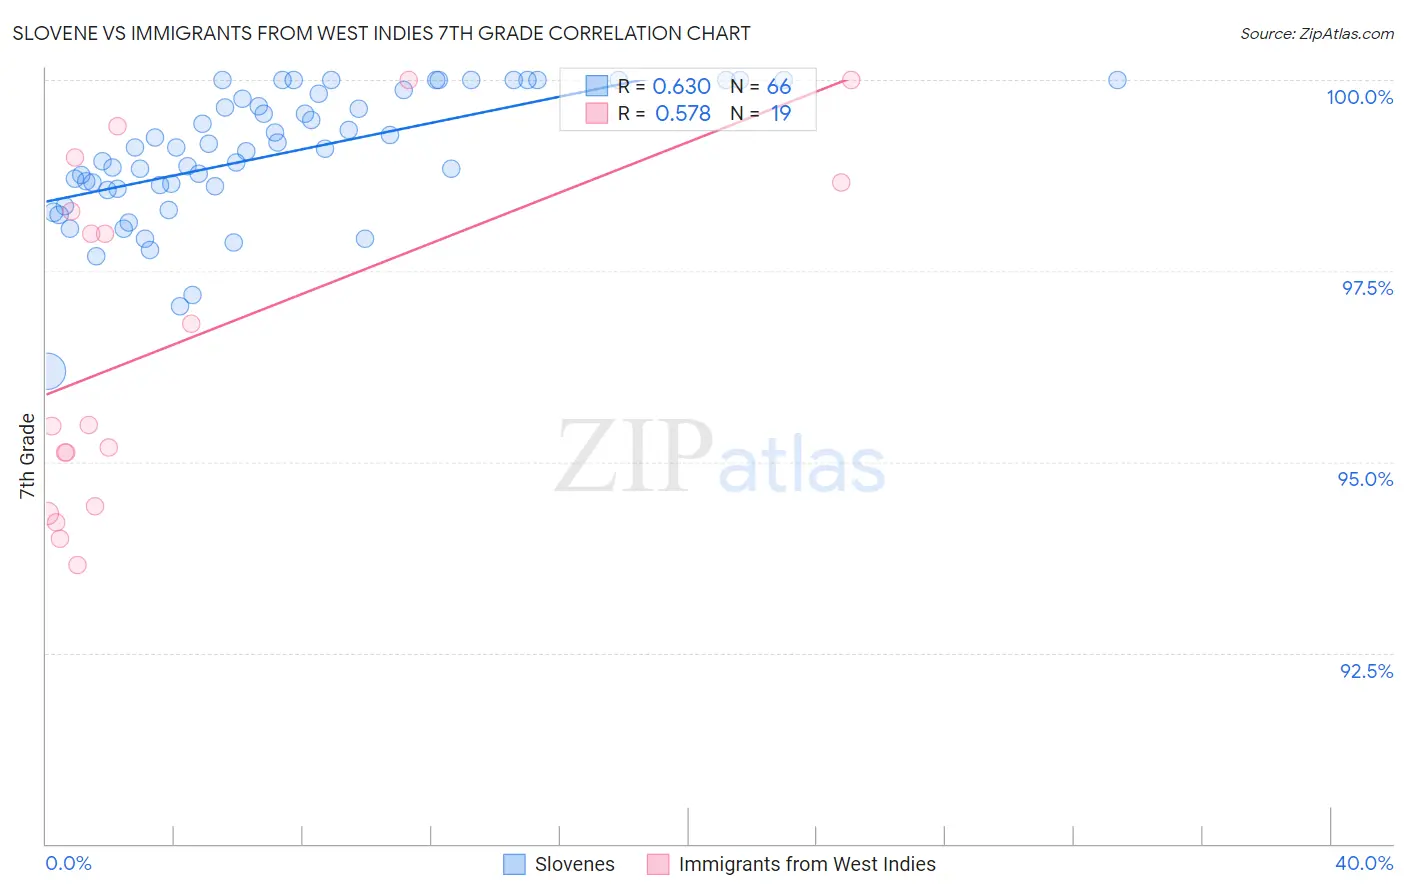
Slovene vs Immigrants from West Indies 7th Grade Correlation Chart
The statistical analysis conducted on geographies consisting of 261,353,374 people shows a significant positive correlation between the proportion of Slovenes and percentage of population with at least 7th grade education in the United States with a correlation coefficient (R) of 0.630 and weighted average of 97.6%. Similarly, the statistical analysis conducted on geographies consisting of 72,457,514 people shows a substantial positive correlation between the proportion of Immigrants from West Indies and percentage of population with at least 7th grade education in the United States with a correlation coefficient (R) of 0.578 and weighted average of 94.8%, a difference of 3.0%.
7th Grade Correlation Summary
| Measurement | Slovene | Immigrants from West Indies |
| Minimum | 96.2% | 93.7% |
| Maximum | 100.0% | 100.0% |
| Range | 3.8% | 6.3% |
| Mean | 99.0% | 96.6% |
| Median | 99.1% | 95.5% |
| Interquartile 25% (IQ1) | 98.6% | 94.4% |
| Interquartile 75% (IQ3) | 99.8% | 98.7% |
| Interquartile Range (IQR) | 1.2% | 4.2% |
| Standard Deviation (Sample) | 0.85% | 2.2% |
| Standard Deviation (Population) | 0.85% | 2.1% |
Similar Demographics by 7th Grade
Demographics Similar to Slovenes by 7th Grade
In terms of 7th grade, the demographic groups most similar to Slovenes are Alaskan Athabascan (97.6%, a difference of 0.010%), Polish (97.6%, a difference of 0.020%), Swedish (97.6%, a difference of 0.050%), Pennsylvania German (97.6%, a difference of 0.060%), and English (97.6%, a difference of 0.070%).
| Demographics | Rating | Rank | 7th Grade |
| Carpatho Rusyns | 100.0 /100 | #3 | Exceptional 98.3% |
| Ottawa | 100.0 /100 | #4 | Exceptional 98.1% |
| Dutch | 100.0 /100 | #5 | Exceptional 97.9% |
| Tsimshian | 100.0 /100 | #6 | Exceptional 97.8% |
| Norwegians | 100.0 /100 | #7 | Exceptional 97.8% |
| Slovaks | 100.0 /100 | #8 | Exceptional 97.8% |
| Germans | 100.0 /100 | #9 | Exceptional 97.7% |
| Slovenes | 100.0 /100 | #10 | Exceptional 97.6% |
| Alaskan Athabascans | 100.0 /100 | #11 | Exceptional 97.6% |
| Poles | 100.0 /100 | #12 | Exceptional 97.6% |
| Swedes | 100.0 /100 | #13 | Exceptional 97.6% |
| Pennsylvania Germans | 100.0 /100 | #14 | Exceptional 97.6% |
| English | 100.0 /100 | #15 | Exceptional 97.6% |
| Irish | 100.0 /100 | #16 | Exceptional 97.5% |
| Scottish | 100.0 /100 | #17 | Exceptional 97.5% |
Demographics Similar to Immigrants from West Indies by 7th Grade
In terms of 7th grade, the demographic groups most similar to Immigrants from West Indies are Immigrants from Grenada (94.8%, a difference of 0.020%), Fijian (94.7%, a difference of 0.020%), Malaysian (94.8%, a difference of 0.060%), Taiwanese (94.8%, a difference of 0.080%), and British West Indian (94.8%, a difference of 0.090%).
| Demographics | Rating | Rank | 7th Grade |
| Immigrants | Eritrea | 0.1 /100 | #285 | Tragic 94.9% |
| Immigrants | Philippines | 0.0 /100 | #286 | Tragic 94.9% |
| Immigrants | Peru | 0.0 /100 | #287 | Tragic 94.9% |
| British West Indians | 0.0 /100 | #288 | Tragic 94.8% |
| Taiwanese | 0.0 /100 | #289 | Tragic 94.8% |
| Malaysians | 0.0 /100 | #290 | Tragic 94.8% |
| Immigrants | Grenada | 0.0 /100 | #291 | Tragic 94.8% |
| Immigrants | West Indies | 0.0 /100 | #292 | Tragic 94.8% |
| Fijians | 0.0 /100 | #293 | Tragic 94.7% |
| Haitians | 0.0 /100 | #294 | Tragic 94.7% |
| Yaqui | 0.0 /100 | #295 | Tragic 94.6% |
| Cubans | 0.0 /100 | #296 | Tragic 94.6% |
| Immigrants | South Eastern Asia | 0.0 /100 | #297 | Tragic 94.5% |
| Indonesians | 0.0 /100 | #298 | Tragic 94.5% |
| Bangladeshis | 0.0 /100 | #299 | Tragic 94.5% |