Vietnamese vs Immigrants from West Indies 7th Grade
COMPARE
Vietnamese
Immigrants from West Indies
7th Grade
7th Grade Comparison
Vietnamese
Immigrants from West Indies
93.9%
7TH GRADE
0.0/ 100
METRIC RATING
315th/ 347
METRIC RANK
94.8%
7TH GRADE
0.0/ 100
METRIC RATING
292nd/ 347
METRIC RANK
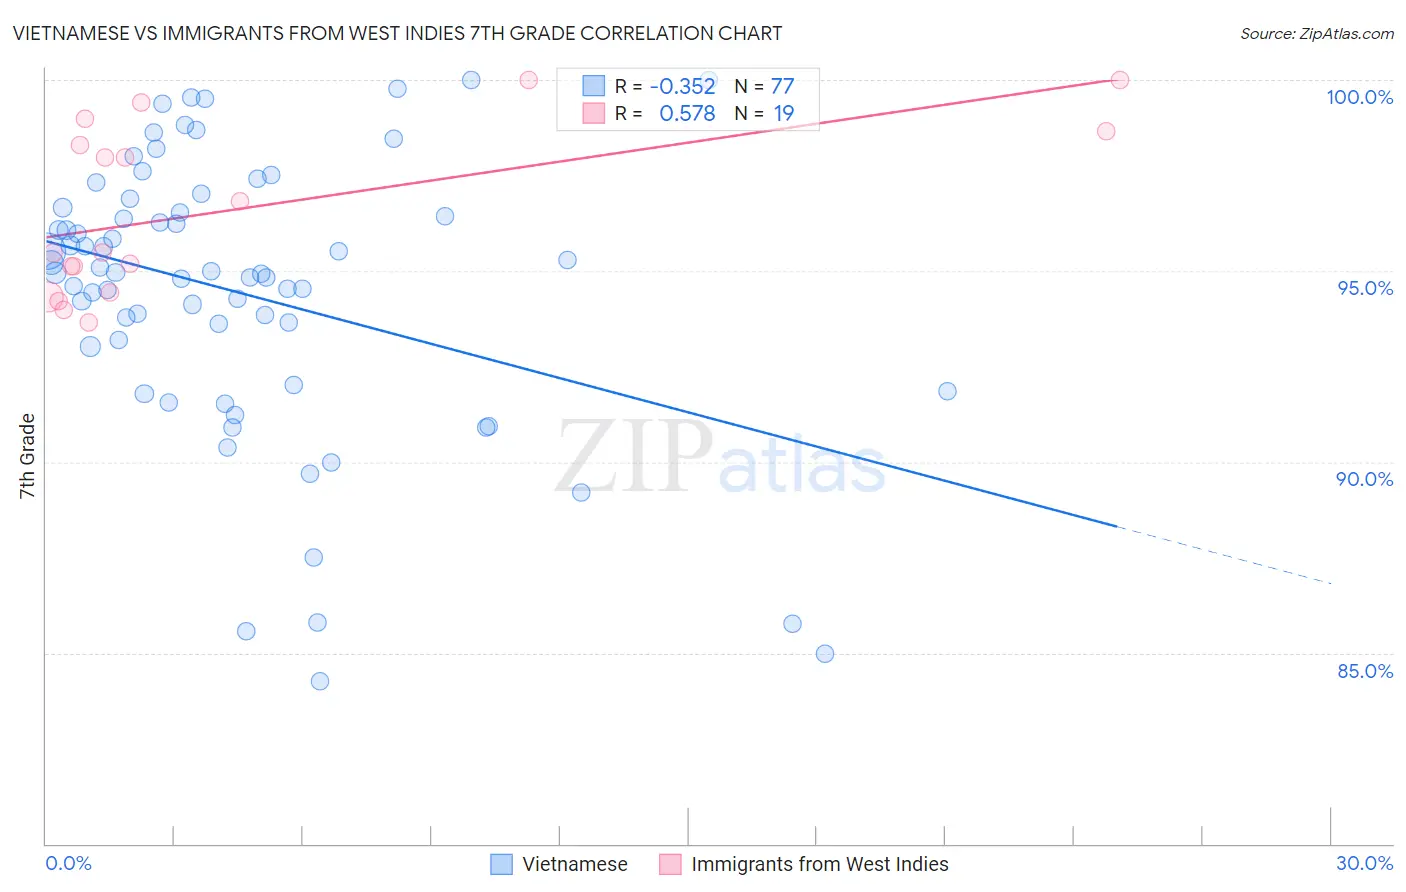
Vietnamese vs Immigrants from West Indies 7th Grade Correlation Chart
The statistical analysis conducted on geographies consisting of 170,728,240 people shows a mild negative correlation between the proportion of Vietnamese and percentage of population with at least 7th grade education in the United States with a correlation coefficient (R) of -0.352 and weighted average of 93.9%. Similarly, the statistical analysis conducted on geographies consisting of 72,457,514 people shows a substantial positive correlation between the proportion of Immigrants from West Indies and percentage of population with at least 7th grade education in the United States with a correlation coefficient (R) of 0.578 and weighted average of 94.8%, a difference of 0.91%.
7th Grade Correlation Summary
| Measurement | Vietnamese | Immigrants from West Indies |
| Minimum | 84.3% | 93.7% |
| Maximum | 100.0% | 100.0% |
| Range | 15.7% | 6.3% |
| Mean | 94.4% | 96.6% |
| Median | 95.0% | 95.5% |
| Interquartile 25% (IQ1) | 92.5% | 94.4% |
| Interquartile 75% (IQ3) | 96.6% | 98.7% |
| Interquartile Range (IQR) | 4.1% | 4.2% |
| Standard Deviation (Sample) | 3.6% | 2.2% |
| Standard Deviation (Population) | 3.6% | 2.1% |
Similar Demographics by 7th Grade
Demographics Similar to Vietnamese by 7th Grade
In terms of 7th grade, the demographic groups most similar to Vietnamese are Immigrants from Vietnam (93.9%, a difference of 0.030%), Japanese (94.0%, a difference of 0.050%), Immigrants from Bangladesh (94.0%, a difference of 0.080%), Immigrants (94.0%, a difference of 0.090%), and Immigrants from Cuba (93.8%, a difference of 0.11%).
| Demographics | Rating | Rank | 7th Grade |
| Cape Verdeans | 0.0 /100 | #308 | Tragic 94.1% |
| Ecuadorians | 0.0 /100 | #309 | Tragic 94.0% |
| Immigrants | Caribbean | 0.0 /100 | #310 | Tragic 94.0% |
| Puerto Ricans | 0.0 /100 | #311 | Tragic 94.0% |
| Immigrants | Immigrants | 0.0 /100 | #312 | Tragic 94.0% |
| Immigrants | Bangladesh | 0.0 /100 | #313 | Tragic 94.0% |
| Japanese | 0.0 /100 | #314 | Tragic 94.0% |
| Vietnamese | 0.0 /100 | #315 | Tragic 93.9% |
| Immigrants | Vietnam | 0.0 /100 | #316 | Tragic 93.9% |
| Immigrants | Cuba | 0.0 /100 | #317 | Tragic 93.8% |
| Immigrants | Ecuador | 0.0 /100 | #318 | Tragic 93.7% |
| Immigrants | Cambodia | 0.0 /100 | #319 | Tragic 93.7% |
| Immigrants | Fiji | 0.0 /100 | #320 | Tragic 93.5% |
| Belizeans | 0.0 /100 | #321 | Tragic 93.5% |
| Nicaraguans | 0.0 /100 | #322 | Tragic 93.5% |
Demographics Similar to Immigrants from West Indies by 7th Grade
In terms of 7th grade, the demographic groups most similar to Immigrants from West Indies are Immigrants from Grenada (94.8%, a difference of 0.020%), Fijian (94.7%, a difference of 0.020%), Malaysian (94.8%, a difference of 0.060%), Taiwanese (94.8%, a difference of 0.080%), and British West Indian (94.8%, a difference of 0.090%).
| Demographics | Rating | Rank | 7th Grade |
| Immigrants | Eritrea | 0.1 /100 | #285 | Tragic 94.9% |
| Immigrants | Philippines | 0.0 /100 | #286 | Tragic 94.9% |
| Immigrants | Peru | 0.0 /100 | #287 | Tragic 94.9% |
| British West Indians | 0.0 /100 | #288 | Tragic 94.8% |
| Taiwanese | 0.0 /100 | #289 | Tragic 94.8% |
| Malaysians | 0.0 /100 | #290 | Tragic 94.8% |
| Immigrants | Grenada | 0.0 /100 | #291 | Tragic 94.8% |
| Immigrants | West Indies | 0.0 /100 | #292 | Tragic 94.8% |
| Fijians | 0.0 /100 | #293 | Tragic 94.7% |
| Haitians | 0.0 /100 | #294 | Tragic 94.7% |
| Yaqui | 0.0 /100 | #295 | Tragic 94.6% |
| Cubans | 0.0 /100 | #296 | Tragic 94.6% |
| Immigrants | South Eastern Asia | 0.0 /100 | #297 | Tragic 94.5% |
| Indonesians | 0.0 /100 | #298 | Tragic 94.5% |
| Bangladeshis | 0.0 /100 | #299 | Tragic 94.5% |