Scandinavian vs Immigrants from South America 9th Grade
COMPARE
Scandinavian
Immigrants from South America
9th Grade
9th Grade Comparison
Scandinavians
Immigrants from South America
96.5%
9TH GRADE
100.0/ 100
METRIC RATING
18th/ 347
METRIC RANK
93.8%
9TH GRADE
0.2/ 100
METRIC RATING
273rd/ 347
METRIC RANK
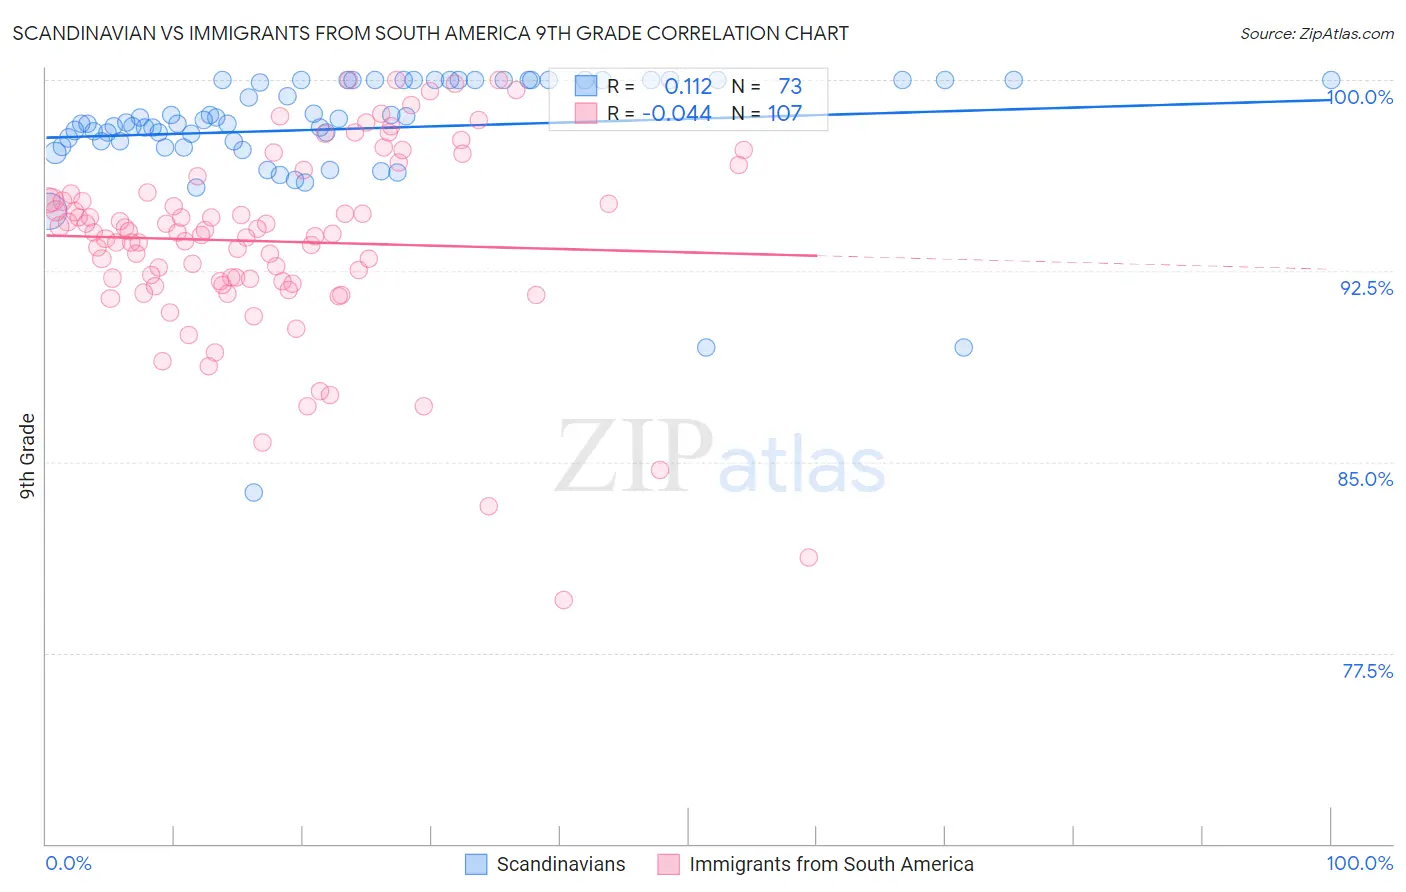
Scandinavian vs Immigrants from South America 9th Grade Correlation Chart
The statistical analysis conducted on geographies consisting of 472,660,435 people shows a poor positive correlation between the proportion of Scandinavians and percentage of population with at least 9th grade education in the United States with a correlation coefficient (R) of 0.112 and weighted average of 96.5%. Similarly, the statistical analysis conducted on geographies consisting of 486,312,594 people shows no correlation between the proportion of Immigrants from South America and percentage of population with at least 9th grade education in the United States with a correlation coefficient (R) of -0.044 and weighted average of 93.8%, a difference of 2.9%.
9th Grade Correlation Summary
| Measurement | Scandinavian | Immigrants from South America |
| Minimum | 83.8% | 79.6% |
| Maximum | 100.0% | 100.0% |
| Range | 16.2% | 20.4% |
| Mean | 98.1% | 93.7% |
| Median | 98.3% | 94.0% |
| Interquartile 25% (IQ1) | 97.6% | 92.1% |
| Interquartile 75% (IQ3) | 100.0% | 95.5% |
| Interquartile Range (IQR) | 2.4% | 3.4% |
| Standard Deviation (Sample) | 2.6% | 3.8% |
| Standard Deviation (Population) | 2.6% | 3.7% |
Similar Demographics by 9th Grade
Demographics Similar to Scandinavians by 9th Grade
In terms of 9th grade, the demographic groups most similar to Scandinavians are Dutch (96.5%, a difference of 0.020%), Welsh (96.4%, a difference of 0.040%), Italian (96.4%, a difference of 0.040%), Alaskan Athabascan (96.4%, a difference of 0.050%), and European (96.4%, a difference of 0.060%).
| Demographics | Rating | Rank | 9th Grade |
| Finns | 100.0 /100 | #11 | Exceptional 96.6% |
| English | 100.0 /100 | #12 | Exceptional 96.6% |
| Danes | 100.0 /100 | #13 | Exceptional 96.5% |
| Scottish | 100.0 /100 | #14 | Exceptional 96.5% |
| Irish | 100.0 /100 | #15 | Exceptional 96.5% |
| Croatians | 100.0 /100 | #16 | Exceptional 96.5% |
| Dutch | 100.0 /100 | #17 | Exceptional 96.5% |
| Scandinavians | 100.0 /100 | #18 | Exceptional 96.5% |
| Welsh | 100.0 /100 | #19 | Exceptional 96.4% |
| Italians | 100.0 /100 | #20 | Exceptional 96.4% |
| Alaskan Athabascans | 100.0 /100 | #21 | Exceptional 96.4% |
| Europeans | 100.0 /100 | #22 | Exceptional 96.4% |
| Czechs | 100.0 /100 | #23 | Exceptional 96.4% |
| Latvians | 100.0 /100 | #24 | Exceptional 96.4% |
| French | 100.0 /100 | #25 | Exceptional 96.3% |
Demographics Similar to Immigrants from South America by 9th Grade
In terms of 9th grade, the demographic groups most similar to Immigrants from South America are Peruvian (93.8%, a difference of 0.0%), Immigrants from Western Africa (93.8%, a difference of 0.010%), Immigrants from Colombia (93.8%, a difference of 0.010%), Immigrants from Ghana (93.8%, a difference of 0.020%), and West Indian (93.7%, a difference of 0.030%).
| Demographics | Rating | Rank | 9th Grade |
| Navajo | 0.3 /100 | #266 | Tragic 93.9% |
| Armenians | 0.3 /100 | #267 | Tragic 93.9% |
| Immigrants | Bolivia | 0.3 /100 | #268 | Tragic 93.9% |
| Immigrants | Uruguay | 0.2 /100 | #269 | Tragic 93.8% |
| Yuman | 0.2 /100 | #270 | Tragic 93.8% |
| Immigrants | Ghana | 0.2 /100 | #271 | Tragic 93.8% |
| Immigrants | Western Africa | 0.2 /100 | #272 | Tragic 93.8% |
| Immigrants | South America | 0.2 /100 | #273 | Tragic 93.8% |
| Peruvians | 0.2 /100 | #274 | Tragic 93.8% |
| Immigrants | Colombia | 0.2 /100 | #275 | Tragic 93.8% |
| West Indians | 0.2 /100 | #276 | Tragic 93.7% |
| Immigrants | Philippines | 0.1 /100 | #277 | Tragic 93.7% |
| Immigrants | Eritrea | 0.1 /100 | #278 | Tragic 93.7% |
| Trinidadians and Tobagonians | 0.1 /100 | #279 | Tragic 93.7% |
| Taiwanese | 0.1 /100 | #280 | Tragic 93.6% |