Hmong vs Arapaho Doctorate Degree
COMPARE
Hmong
Arapaho
Doctorate Degree
Doctorate Degree Comparison
Hmong
Arapaho
1.6%
DOCTORATE DEGREE
1.8/ 100
METRIC RATING
246th/ 347
METRIC RANK
1.2%
DOCTORATE DEGREE
0.0/ 100
METRIC RATING
342nd/ 347
METRIC RANK
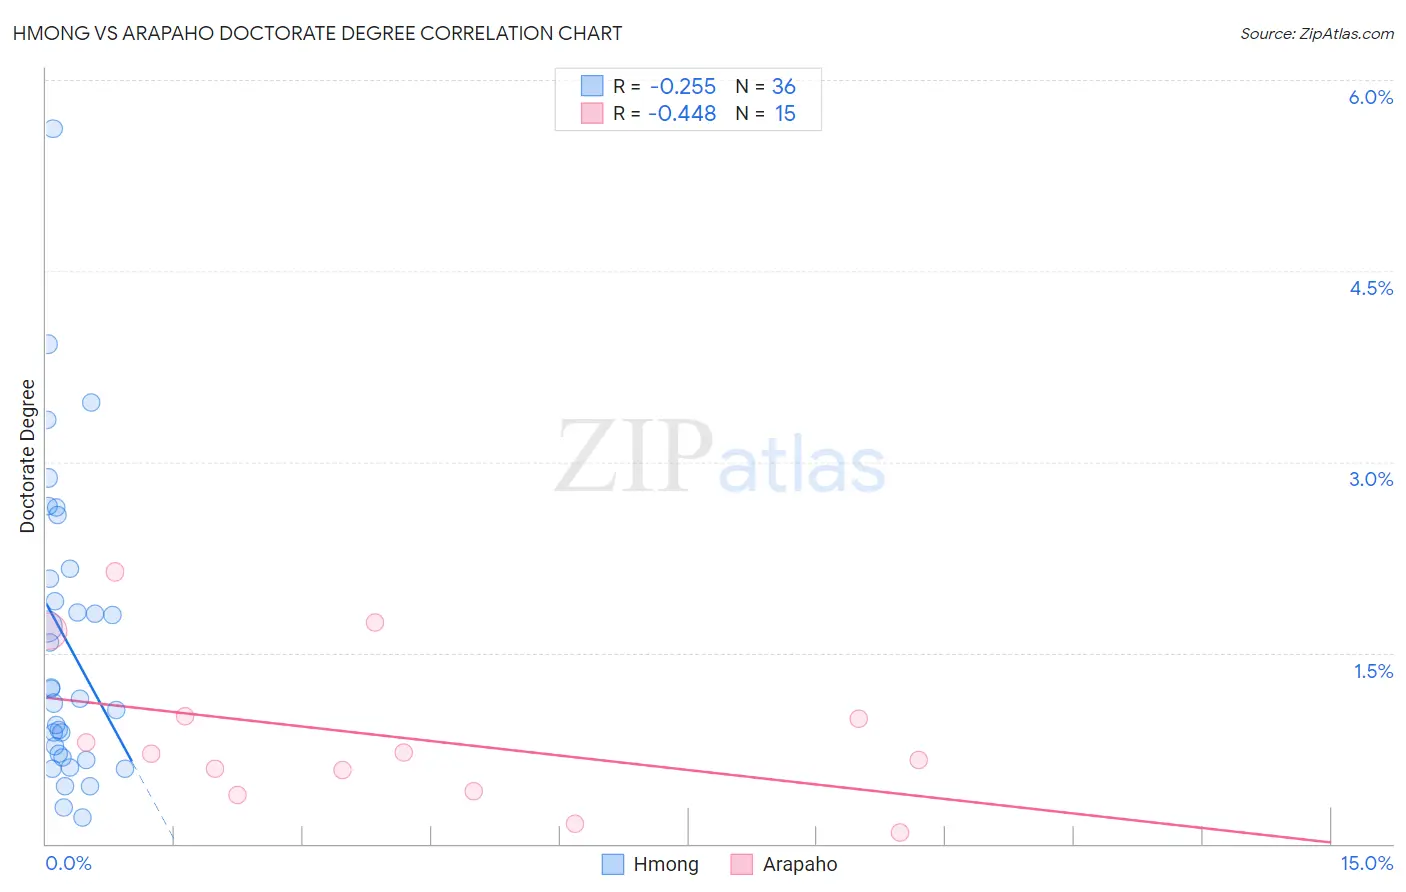
Hmong vs Arapaho Doctorate Degree Correlation Chart
The statistical analysis conducted on geographies consisting of 24,653,481 people shows a weak negative correlation between the proportion of Hmong and percentage of population with at least doctorate degree education in the United States with a correlation coefficient (R) of -0.255 and weighted average of 1.6%. Similarly, the statistical analysis conducted on geographies consisting of 29,522,759 people shows a moderate negative correlation between the proportion of Arapaho and percentage of population with at least doctorate degree education in the United States with a correlation coefficient (R) of -0.448 and weighted average of 1.2%, a difference of 34.6%.
Doctorate Degree Correlation Summary
| Measurement | Hmong | Arapaho |
| Minimum | 0.21% | 0.090% |
| Maximum | 5.6% | 2.1% |
| Range | 5.4% | 2.0% |
| Mean | 1.6% | 0.84% |
| Median | 1.2% | 0.71% |
| Interquartile 25% (IQ1) | 0.69% | 0.41% |
| Interquartile 75% (IQ3) | 2.1% | 1.0% |
| Interquartile Range (IQR) | 1.4% | 0.59% |
| Standard Deviation (Sample) | 1.2% | 0.59% |
| Standard Deviation (Population) | 1.2% | 0.57% |
Similar Demographics by Doctorate Degree
Demographics Similar to Hmong by Doctorate Degree
In terms of doctorate degree, the demographic groups most similar to Hmong are Comanche (1.6%, a difference of 0.020%), Delaware (1.6%, a difference of 0.10%), African (1.6%, a difference of 0.14%), French American Indian (1.6%, a difference of 0.47%), and Potawatomi (1.6%, a difference of 0.61%).
| Demographics | Rating | Rank | Doctorate Degree |
| West Indians | 2.5 /100 | #239 | Tragic 1.6% |
| Immigrants | Panama | 2.4 /100 | #240 | Tragic 1.6% |
| Cheyenne | 2.3 /100 | #241 | Tragic 1.6% |
| Ottawa | 2.2 /100 | #242 | Tragic 1.6% |
| Native Hawaiians | 2.1 /100 | #243 | Tragic 1.6% |
| French American Indians | 2.0 /100 | #244 | Tragic 1.6% |
| Delaware | 1.9 /100 | #245 | Tragic 1.6% |
| Hmong | 1.8 /100 | #246 | Tragic 1.6% |
| Comanche | 1.8 /100 | #247 | Tragic 1.6% |
| Africans | 1.8 /100 | #248 | Tragic 1.6% |
| Potawatomi | 1.6 /100 | #249 | Tragic 1.6% |
| Immigrants | Fiji | 1.6 /100 | #250 | Tragic 1.6% |
| Apache | 1.3 /100 | #251 | Tragic 1.5% |
| Yuman | 1.1 /100 | #252 | Tragic 1.5% |
| Americans | 1.0 /100 | #253 | Tragic 1.5% |
Demographics Similar to Arapaho by Doctorate Degree
In terms of doctorate degree, the demographic groups most similar to Arapaho are Mexican (1.2%, a difference of 0.38%), Immigrants from Cuba (1.2%, a difference of 0.86%), Immigrants from Central America (1.2%, a difference of 1.7%), Puget Sound Salish (1.2%, a difference of 3.0%), and Fijian (1.1%, a difference of 3.4%).
| Demographics | Rating | Rank | Doctorate Degree |
| Immigrants | Caribbean | 0.0 /100 | #333 | Tragic 1.3% |
| Immigrants | Dominican Republic | 0.0 /100 | #334 | Tragic 1.3% |
| Immigrants | Haiti | 0.0 /100 | #335 | Tragic 1.3% |
| Nepalese | 0.0 /100 | #336 | Tragic 1.3% |
| Bangladeshis | 0.0 /100 | #337 | Tragic 1.2% |
| Puget Sound Salish | 0.0 /100 | #338 | Tragic 1.2% |
| Immigrants | Central America | 0.0 /100 | #339 | Tragic 1.2% |
| Immigrants | Cuba | 0.0 /100 | #340 | Tragic 1.2% |
| Mexicans | 0.0 /100 | #341 | Tragic 1.2% |
| Arapaho | 0.0 /100 | #342 | Tragic 1.2% |
| Fijians | 0.0 /100 | #343 | Tragic 1.1% |
| Immigrants | Mexico | 0.0 /100 | #344 | Tragic 1.1% |
| Lumbee | 0.0 /100 | #345 | Tragic 1.1% |
| Spanish American Indians | 0.0 /100 | #346 | Tragic 1.1% |
| Houma | 0.0 /100 | #347 | Tragic 0.96% |