Dominican vs Immigrants from Argentina Master's Degree
COMPARE
Dominican
Immigrants from Argentina
Master's Degree
Master's Degree Comparison
Dominicans
Immigrants from Argentina
12.5%
MASTER'S DEGREE
0.6/ 100
METRIC RATING
260th/ 347
METRIC RANK
18.0%
MASTER'S DEGREE
99.8/ 100
METRIC RATING
67th/ 347
METRIC RANK
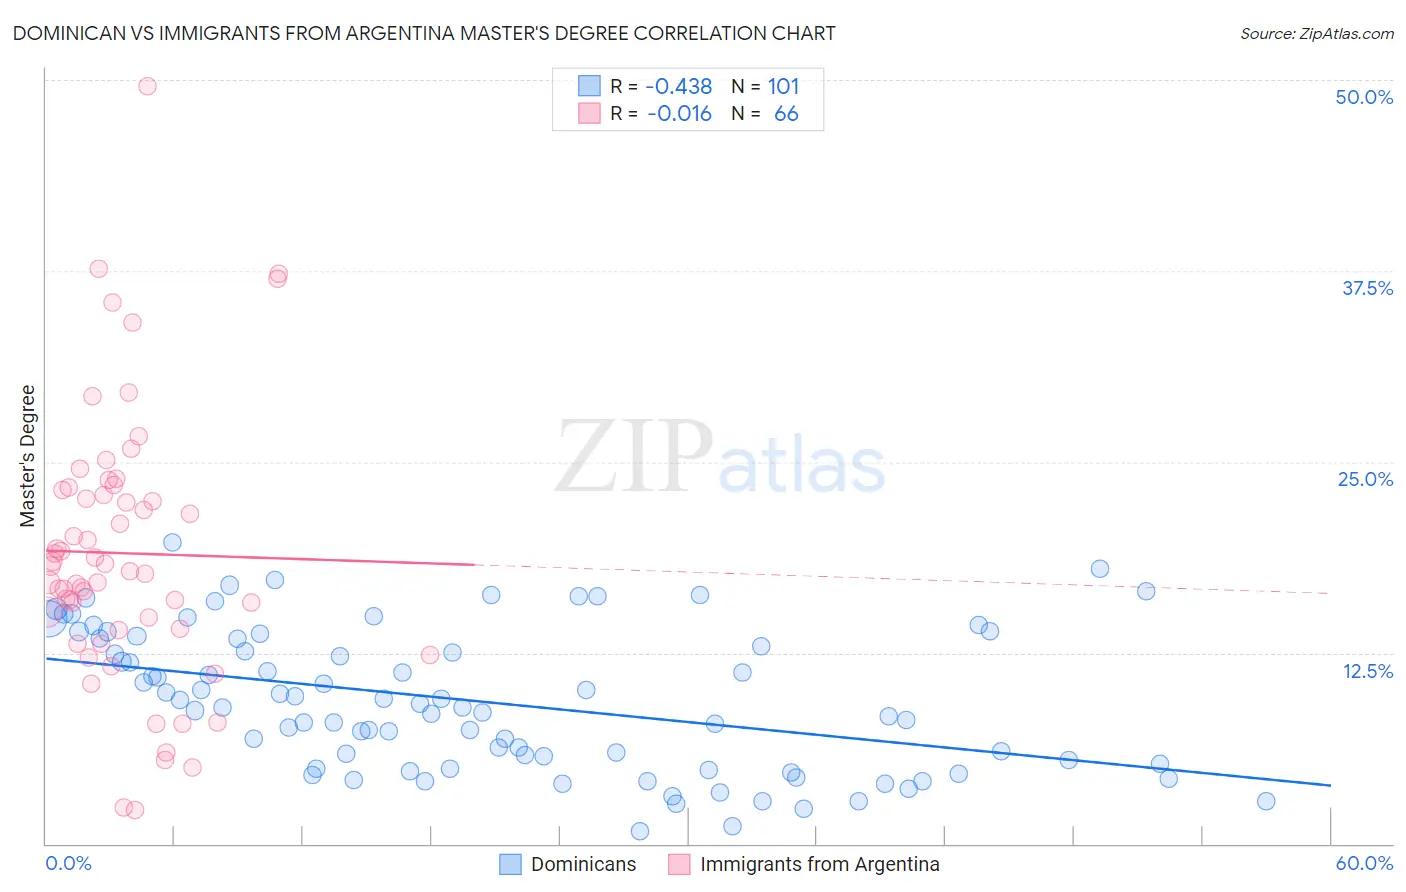
Dominican vs Immigrants from Argentina Master's Degree Correlation Chart
The statistical analysis conducted on geographies consisting of 354,930,218 people shows a moderate negative correlation between the proportion of Dominicans and percentage of population with at least master's degree education in the United States with a correlation coefficient (R) of -0.438 and weighted average of 12.5%. Similarly, the statistical analysis conducted on geographies consisting of 264,373,397 people shows no correlation between the proportion of Immigrants from Argentina and percentage of population with at least master's degree education in the United States with a correlation coefficient (R) of -0.016 and weighted average of 18.0%, a difference of 43.8%.
Master's Degree Correlation Summary
| Measurement | Dominican | Immigrants from Argentina |
| Minimum | 0.79% | 2.2% |
| Maximum | 19.7% | 49.6% |
| Range | 18.9% | 47.3% |
| Mean | 9.3% | 19.0% |
| Median | 9.0% | 18.0% |
| Interquartile 25% (IQ1) | 5.1% | 14.1% |
| Interquartile 75% (IQ3) | 13.4% | 23.1% |
| Interquartile Range (IQR) | 8.3% | 9.0% |
| Standard Deviation (Sample) | 4.6% | 8.8% |
| Standard Deviation (Population) | 4.5% | 8.7% |
Similar Demographics by Master's Degree
Demographics Similar to Dominicans by Master's Degree
In terms of master's degree, the demographic groups most similar to Dominicans are Japanese (12.5%, a difference of 0.010%), Tongan (12.5%, a difference of 0.040%), Immigrants from Liberia (12.5%, a difference of 0.10%), Nicaraguan (12.5%, a difference of 0.22%), and Central American Indian (12.4%, a difference of 0.46%).
| Demographics | Rating | Rank | Master's Degree |
| Immigrants | Dominica | 0.8 /100 | #253 | Tragic 12.6% |
| Indonesians | 0.8 /100 | #254 | Tragic 12.6% |
| Immigrants | Congo | 0.8 /100 | #255 | Tragic 12.6% |
| Immigrants | Portugal | 0.8 /100 | #256 | Tragic 12.6% |
| Osage | 0.7 /100 | #257 | Tragic 12.6% |
| Immigrants | Liberia | 0.6 /100 | #258 | Tragic 12.5% |
| Japanese | 0.6 /100 | #259 | Tragic 12.5% |
| Dominicans | 0.6 /100 | #260 | Tragic 12.5% |
| Tongans | 0.6 /100 | #261 | Tragic 12.5% |
| Nicaraguans | 0.6 /100 | #262 | Tragic 12.5% |
| Central American Indians | 0.5 /100 | #263 | Tragic 12.4% |
| Belizeans | 0.5 /100 | #264 | Tragic 12.4% |
| Immigrants | Fiji | 0.5 /100 | #265 | Tragic 12.4% |
| Bahamians | 0.5 /100 | #266 | Tragic 12.4% |
| Americans | 0.4 /100 | #267 | Tragic 12.3% |
Demographics Similar to Immigrants from Argentina by Master's Degree
In terms of master's degree, the demographic groups most similar to Immigrants from Argentina are Ethiopian (18.0%, a difference of 0.050%), Immigrants from Kazakhstan (18.0%, a difference of 0.070%), Immigrants from Ethiopia (17.9%, a difference of 0.23%), Immigrants from Uzbekistan (17.9%, a difference of 0.55%), and Immigrants from Western Europe (17.8%, a difference of 0.77%).
| Demographics | Rating | Rank | Master's Degree |
| New Zealanders | 99.9 /100 | #60 | Exceptional 18.3% |
| Immigrants | Europe | 99.9 /100 | #61 | Exceptional 18.2% |
| Argentineans | 99.9 /100 | #62 | Exceptional 18.2% |
| Immigrants | Netherlands | 99.9 /100 | #63 | Exceptional 18.1% |
| South Africans | 99.9 /100 | #64 | Exceptional 18.1% |
| Immigrants | Kazakhstan | 99.8 /100 | #65 | Exceptional 18.0% |
| Ethiopians | 99.8 /100 | #66 | Exceptional 18.0% |
| Immigrants | Argentina | 99.8 /100 | #67 | Exceptional 18.0% |
| Immigrants | Ethiopia | 99.8 /100 | #68 | Exceptional 17.9% |
| Immigrants | Uzbekistan | 99.8 /100 | #69 | Exceptional 17.9% |
| Immigrants | Western Europe | 99.8 /100 | #70 | Exceptional 17.8% |
| Immigrants | Pakistan | 99.7 /100 | #71 | Exceptional 17.8% |
| Lithuanians | 99.7 /100 | #72 | Exceptional 17.7% |
| Zimbabweans | 99.7 /100 | #73 | Exceptional 17.7% |
| Immigrants | Romania | 99.7 /100 | #74 | Exceptional 17.7% |