Immigrants from Denmark vs Barbadian Bachelor's Degree
COMPARE
Immigrants from Denmark
Barbadian
Bachelor's Degree
Bachelor's Degree Comparison
Immigrants from Denmark
Barbadians
45.4%
BACHELOR'S DEGREE
100.0/ 100
METRIC RATING
34th/ 347
METRIC RANK
36.1%
BACHELOR'S DEGREE
13.5/ 100
METRIC RATING
216th/ 347
METRIC RANK
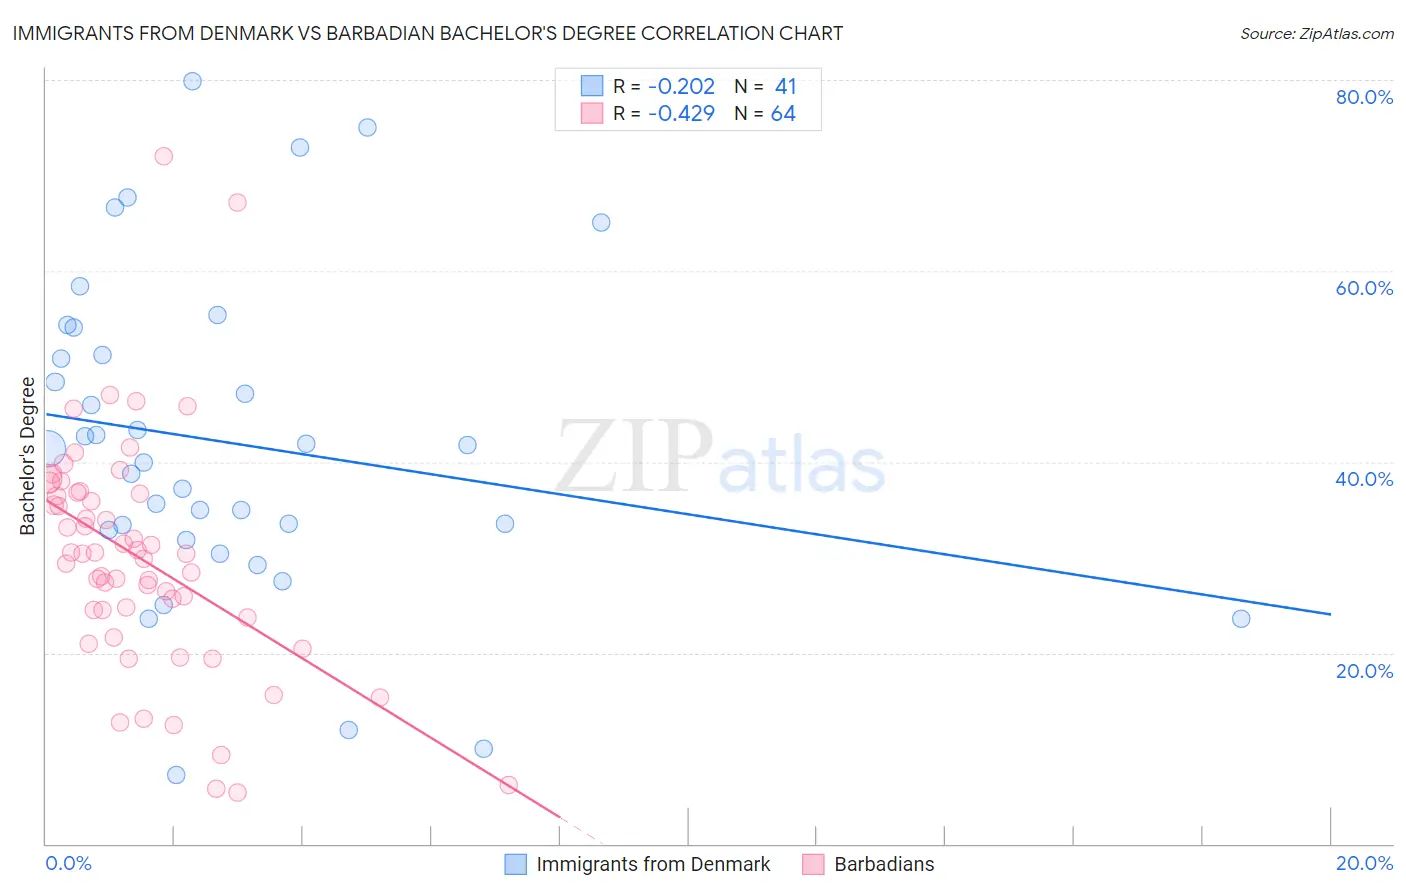
Immigrants from Denmark vs Barbadian Bachelor's Degree Correlation Chart
The statistical analysis conducted on geographies consisting of 136,428,731 people shows a weak negative correlation between the proportion of Immigrants from Denmark and percentage of population with at least bachelor's degree education in the United States with a correlation coefficient (R) of -0.202 and weighted average of 45.4%. Similarly, the statistical analysis conducted on geographies consisting of 141,300,746 people shows a moderate negative correlation between the proportion of Barbadians and percentage of population with at least bachelor's degree education in the United States with a correlation coefficient (R) of -0.429 and weighted average of 36.1%, a difference of 25.8%.
Bachelor's Degree Correlation Summary
| Measurement | Immigrants from Denmark | Barbadian |
| Minimum | 7.2% | 5.4% |
| Maximum | 79.9% | 72.0% |
| Range | 72.7% | 66.6% |
| Mean | 42.0% | 30.0% |
| Median | 41.3% | 30.3% |
| Interquartile 25% (IQ1) | 32.3% | 24.1% |
| Interquartile 75% (IQ3) | 52.7% | 36.8% |
| Interquartile Range (IQR) | 20.3% | 12.7% |
| Standard Deviation (Sample) | 16.9% | 12.3% |
| Standard Deviation (Population) | 16.7% | 12.2% |
Similar Demographics by Bachelor's Degree
Demographics Similar to Immigrants from Denmark by Bachelor's Degree
In terms of bachelor's degree, the demographic groups most similar to Immigrants from Denmark are Immigrants from Russia (45.4%, a difference of 0.030%), Mongolian (45.4%, a difference of 0.040%), Russian (45.3%, a difference of 0.19%), Bulgarian (45.3%, a difference of 0.28%), and Immigrants from Northern Europe (45.6%, a difference of 0.45%).
| Demographics | Rating | Rank | Bachelor's Degree |
| Immigrants | France | 100.0 /100 | #27 | Exceptional 46.4% |
| Turks | 100.0 /100 | #28 | Exceptional 46.2% |
| Israelis | 100.0 /100 | #29 | Exceptional 46.1% |
| Immigrants | Sri Lanka | 100.0 /100 | #30 | Exceptional 46.1% |
| Latvians | 100.0 /100 | #31 | Exceptional 46.1% |
| Immigrants | Turkey | 100.0 /100 | #32 | Exceptional 46.0% |
| Immigrants | Northern Europe | 100.0 /100 | #33 | Exceptional 45.6% |
| Immigrants | Denmark | 100.0 /100 | #34 | Exceptional 45.4% |
| Immigrants | Russia | 100.0 /100 | #35 | Exceptional 45.4% |
| Mongolians | 100.0 /100 | #36 | Exceptional 45.4% |
| Russians | 100.0 /100 | #37 | Exceptional 45.3% |
| Bulgarians | 100.0 /100 | #38 | Exceptional 45.3% |
| Immigrants | Latvia | 100.0 /100 | #39 | Exceptional 45.1% |
| Immigrants | Belarus | 100.0 /100 | #40 | Exceptional 45.0% |
| Immigrants | Malaysia | 100.0 /100 | #41 | Exceptional 45.0% |
Demographics Similar to Barbadians by Bachelor's Degree
In terms of bachelor's degree, the demographic groups most similar to Barbadians are Immigrants from Western Africa (36.1%, a difference of 0.060%), German (36.1%, a difference of 0.090%), Immigrants from Panama (36.2%, a difference of 0.16%), German Russian (35.8%, a difference of 0.81%), and Immigrants from Philippines (36.4%, a difference of 0.84%).
| Demographics | Rating | Rank | Bachelor's Degree |
| Panamanians | 18.8 /100 | #209 | Poor 36.5% |
| French | 18.6 /100 | #210 | Poor 36.5% |
| Scotch-Irish | 18.3 /100 | #211 | Poor 36.4% |
| Immigrants | Philippines | 17.8 /100 | #212 | Poor 36.4% |
| Immigrants | Panama | 14.2 /100 | #213 | Poor 36.2% |
| Germans | 13.9 /100 | #214 | Poor 36.1% |
| Immigrants | Western Africa | 13.8 /100 | #215 | Poor 36.1% |
| Barbadians | 13.5 /100 | #216 | Poor 36.1% |
| German Russians | 10.2 /100 | #217 | Poor 35.8% |
| Sub-Saharan Africans | 9.8 /100 | #218 | Tragic 35.8% |
| West Indians | 9.7 /100 | #219 | Tragic 35.8% |
| Spanish | 9.6 /100 | #220 | Tragic 35.8% |
| Dutch | 9.2 /100 | #221 | Tragic 35.7% |
| Trinidadians and Tobagonians | 8.8 /100 | #222 | Tragic 35.7% |
| French Canadians | 8.3 /100 | #223 | Tragic 35.6% |