Icelander vs Immigrants from Brazil College, 1 year or more
COMPARE
Icelander
Immigrants from Brazil
College, 1 year or more
College, 1 year or more Comparison
Icelanders
Immigrants from Brazil
62.1%
COLLEGE, 1 YEAR OR MORE
96.8/ 100
METRIC RATING
100th/ 347
METRIC RANK
61.6%
COLLEGE, 1 YEAR OR MORE
93.9/ 100
METRIC RATING
118th/ 347
METRIC RANK
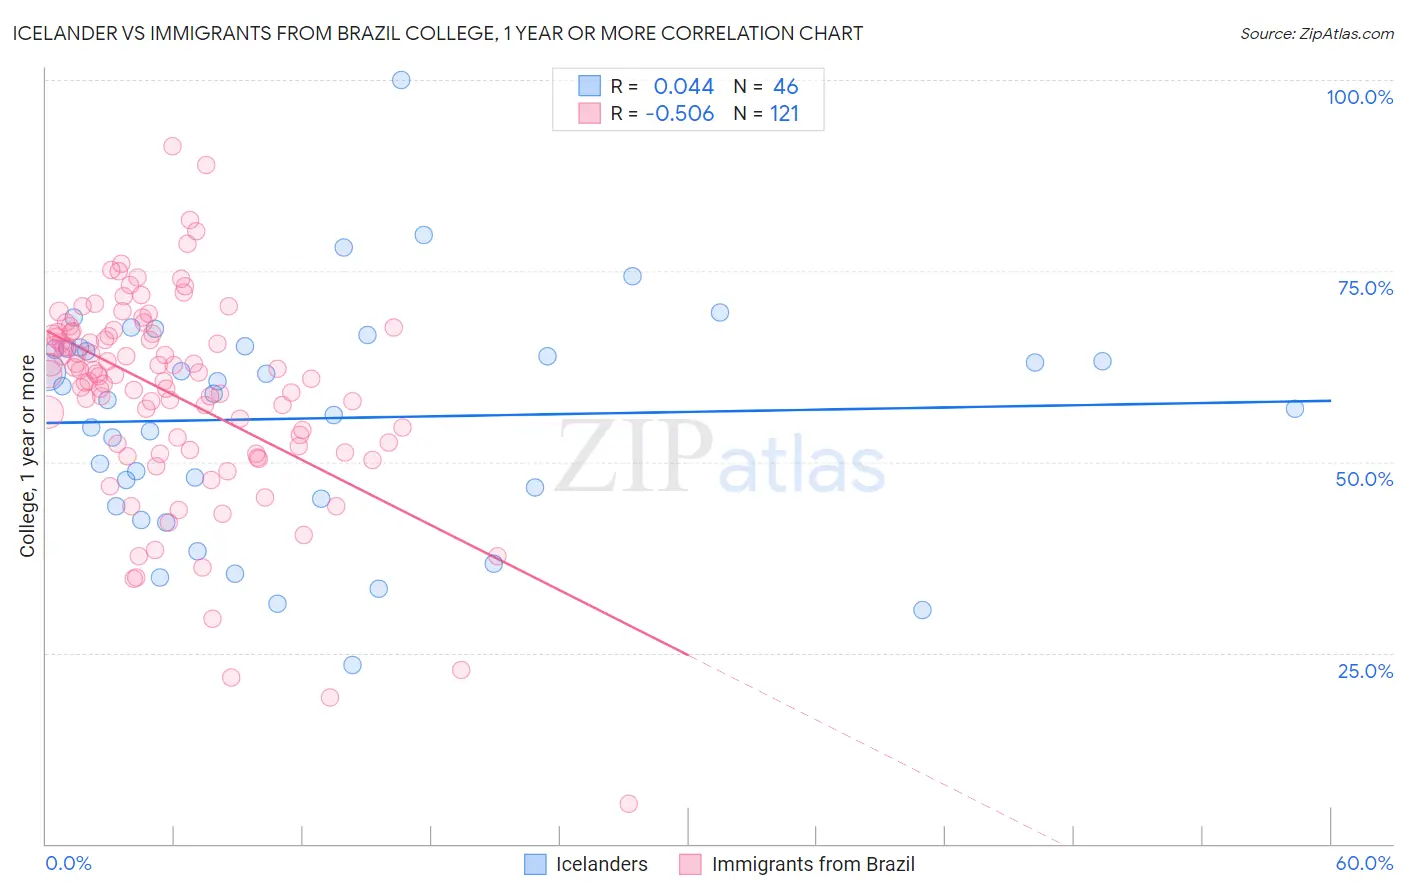
Icelander vs Immigrants from Brazil College, 1 year or more Correlation Chart
The statistical analysis conducted on geographies consisting of 159,668,975 people shows no correlation between the proportion of Icelanders and percentage of population with at least college, 1 year or more education in the United States with a correlation coefficient (R) of 0.044 and weighted average of 62.1%. Similarly, the statistical analysis conducted on geographies consisting of 343,021,697 people shows a substantial negative correlation between the proportion of Immigrants from Brazil and percentage of population with at least college, 1 year or more education in the United States with a correlation coefficient (R) of -0.506 and weighted average of 61.6%, a difference of 0.85%.
College, 1 year or more Correlation Summary
| Measurement | Icelander | Immigrants from Brazil |
| Minimum | 23.3% | 5.3% |
| Maximum | 100.0% | 91.3% |
| Range | 76.7% | 86.0% |
| Mean | 55.7% | 58.8% |
| Median | 58.5% | 61.4% |
| Interquartile 25% (IQ1) | 45.2% | 51.8% |
| Interquartile 75% (IQ3) | 64.9% | 66.8% |
| Interquartile Range (IQR) | 19.7% | 15.0% |
| Standard Deviation (Sample) | 15.0% | 13.5% |
| Standard Deviation (Population) | 14.8% | 13.4% |
Demographics Similar to Icelanders and Immigrants from Brazil by College, 1 year or more
In terms of college, 1 year or more, the demographic groups most similar to Icelanders are Swedish (62.1%, a difference of 0.0%), Luxembourger (62.1%, a difference of 0.020%), Afghan (62.0%, a difference of 0.13%), Chilean (62.0%, a difference of 0.15%), and Croatian (62.2%, a difference of 0.16%). Similarly, the demographic groups most similar to Immigrants from Brazil are Arab (61.6%, a difference of 0.0%), Lebanese (61.6%, a difference of 0.050%), Assyrian/Chaldean/Syriac (61.5%, a difference of 0.13%), Norwegian (61.7%, a difference of 0.15%), and Danish (61.7%, a difference of 0.22%).
| Demographics | Rating | Rank | College, 1 year or more |
| Croatians | 97.1 /100 | #99 | Exceptional 62.2% |
| Icelanders | 96.8 /100 | #100 | Exceptional 62.1% |
| Swedes | 96.8 /100 | #101 | Exceptional 62.1% |
| Luxembourgers | 96.7 /100 | #102 | Exceptional 62.1% |
| Afghans | 96.4 /100 | #103 | Exceptional 62.0% |
| Chileans | 96.4 /100 | #104 | Exceptional 62.0% |
| Immigrants | Nepal | 96.3 /100 | #105 | Exceptional 62.0% |
| Palestinians | 96.3 /100 | #106 | Exceptional 62.0% |
| Immigrants | Ukraine | 95.8 /100 | #107 | Exceptional 61.9% |
| Syrians | 95.7 /100 | #108 | Exceptional 61.9% |
| Immigrants | Northern Africa | 95.7 /100 | #109 | Exceptional 61.9% |
| Europeans | 95.6 /100 | #110 | Exceptional 61.8% |
| Macedonians | 95.6 /100 | #111 | Exceptional 61.8% |
| Austrians | 95.4 /100 | #112 | Exceptional 61.8% |
| Ukrainians | 95.2 /100 | #113 | Exceptional 61.8% |
| Danes | 94.8 /100 | #114 | Exceptional 61.7% |
| Norwegians | 94.5 /100 | #115 | Exceptional 61.7% |
| Lebanese | 94.1 /100 | #116 | Exceptional 61.6% |
| Arabs | 93.9 /100 | #117 | Exceptional 61.6% |
| Immigrants | Brazil | 93.9 /100 | #118 | Exceptional 61.6% |
| Assyrians/Chaldeans/Syriacs | 93.3 /100 | #119 | Exceptional 61.5% |