Immigrants from Bolivia vs American 9th Grade
COMPARE
Immigrants from Bolivia
American
9th Grade
9th Grade Comparison
Immigrants from Bolivia
Americans
93.9%
9TH GRADE
0.3/ 100
METRIC RATING
268th/ 347
METRIC RANK
95.6%
9TH GRADE
98.5/ 100
METRIC RATING
95th/ 347
METRIC RANK
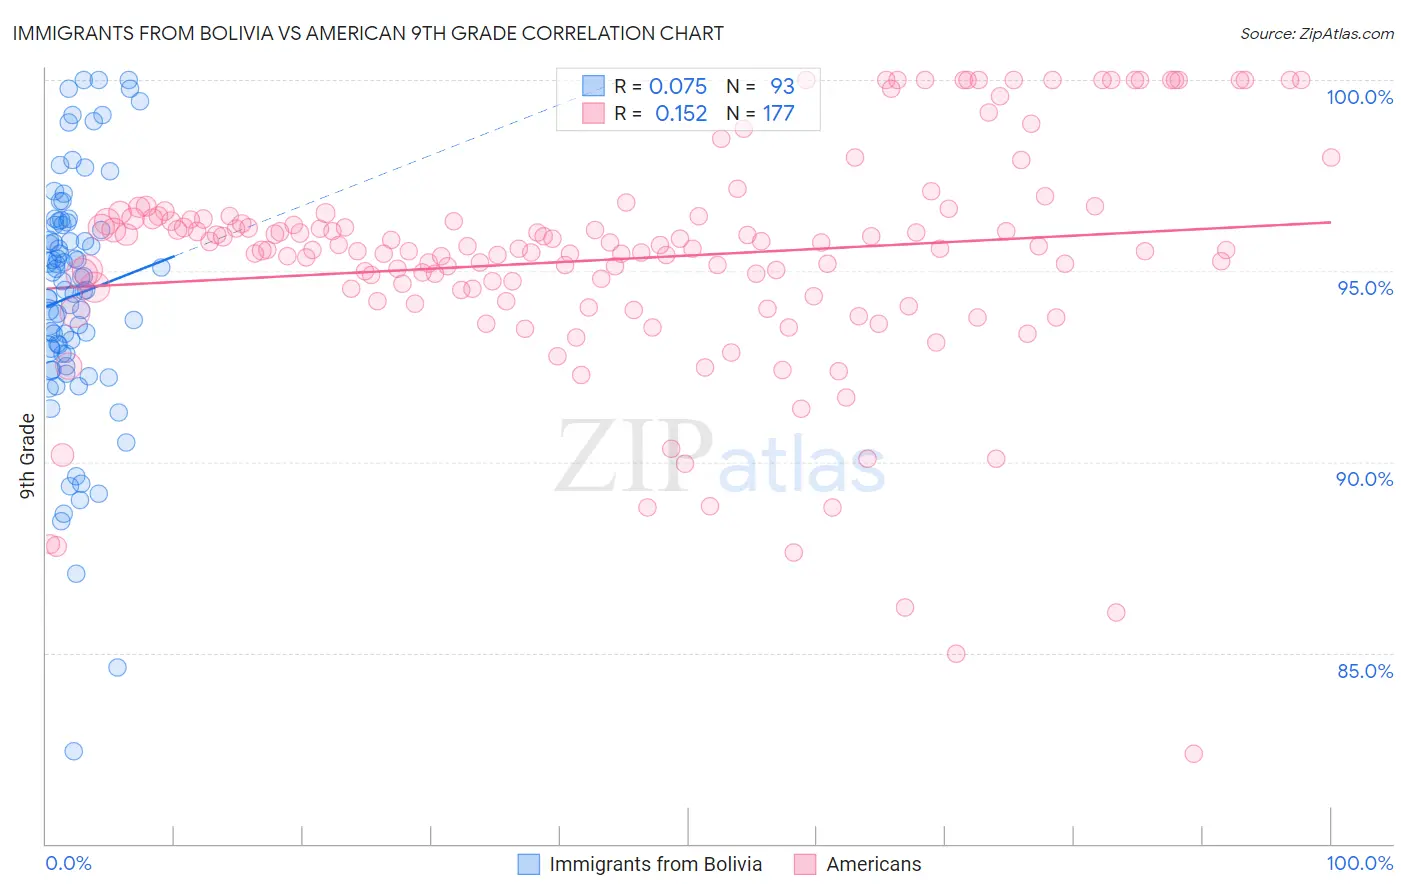
Immigrants from Bolivia vs American 9th Grade Correlation Chart
The statistical analysis conducted on geographies consisting of 158,727,043 people shows a slight positive correlation between the proportion of Immigrants from Bolivia and percentage of population with at least 9th grade education in the United States with a correlation coefficient (R) of 0.075 and weighted average of 93.9%. Similarly, the statistical analysis conducted on geographies consisting of 581,993,497 people shows a poor positive correlation between the proportion of Americans and percentage of population with at least 9th grade education in the United States with a correlation coefficient (R) of 0.152 and weighted average of 95.6%, a difference of 1.9%.
9th Grade Correlation Summary
| Measurement | Immigrants from Bolivia | American |
| Minimum | 82.4% | 82.4% |
| Maximum | 100.0% | 100.0% |
| Range | 17.6% | 17.6% |
| Mean | 94.3% | 95.3% |
| Median | 94.7% | 95.6% |
| Interquartile 25% (IQ1) | 92.8% | 94.4% |
| Interquartile 75% (IQ3) | 96.2% | 96.4% |
| Interquartile Range (IQR) | 3.4% | 2.0% |
| Standard Deviation (Sample) | 3.2% | 3.0% |
| Standard Deviation (Population) | 3.2% | 3.0% |
Similar Demographics by 9th Grade
Demographics Similar to Immigrants from Bolivia by 9th Grade
In terms of 9th grade, the demographic groups most similar to Immigrants from Bolivia are Armenian (93.9%, a difference of 0.020%), Navajo (93.9%, a difference of 0.030%), Immigrants from Congo (93.9%, a difference of 0.040%), Native/Alaskan (93.9%, a difference of 0.040%), and Immigrants from Uruguay (93.8%, a difference of 0.040%).
| Demographics | Rating | Rank | 9th Grade |
| South Americans | 0.4 /100 | #261 | Tragic 93.9% |
| Immigrants | Jamaica | 0.4 /100 | #262 | Tragic 93.9% |
| Immigrants | Uzbekistan | 0.4 /100 | #263 | Tragic 93.9% |
| Immigrants | Congo | 0.4 /100 | #264 | Tragic 93.9% |
| Natives/Alaskans | 0.4 /100 | #265 | Tragic 93.9% |
| Navajo | 0.3 /100 | #266 | Tragic 93.9% |
| Armenians | 0.3 /100 | #267 | Tragic 93.9% |
| Immigrants | Bolivia | 0.3 /100 | #268 | Tragic 93.9% |
| Immigrants | Uruguay | 0.2 /100 | #269 | Tragic 93.8% |
| Yuman | 0.2 /100 | #270 | Tragic 93.8% |
| Immigrants | Ghana | 0.2 /100 | #271 | Tragic 93.8% |
| Immigrants | Western Africa | 0.2 /100 | #272 | Tragic 93.8% |
| Immigrants | South America | 0.2 /100 | #273 | Tragic 93.8% |
| Peruvians | 0.2 /100 | #274 | Tragic 93.8% |
| Immigrants | Colombia | 0.2 /100 | #275 | Tragic 93.8% |
Demographics Similar to Americans by 9th Grade
In terms of 9th grade, the demographic groups most similar to Americans are Filipino (95.6%, a difference of 0.010%), Delaware (95.6%, a difference of 0.010%), Immigrants from Germany (95.6%, a difference of 0.020%), Immigrants from Latvia (95.6%, a difference of 0.020%), and Immigrants from Japan (95.6%, a difference of 0.020%).
| Demographics | Rating | Rank | 9th Grade |
| Immigrants | Czechoslovakia | 98.9 /100 | #88 | Exceptional 95.7% |
| Yugoslavians | 98.9 /100 | #89 | Exceptional 95.7% |
| South Africans | 98.8 /100 | #90 | Exceptional 95.6% |
| Creek | 98.8 /100 | #91 | Exceptional 95.6% |
| Immigrants | Saudi Arabia | 98.8 /100 | #92 | Exceptional 95.6% |
| Immigrants | Germany | 98.7 /100 | #93 | Exceptional 95.6% |
| Immigrants | Latvia | 98.7 /100 | #94 | Exceptional 95.6% |
| Americans | 98.5 /100 | #95 | Exceptional 95.6% |
| Filipinos | 98.5 /100 | #96 | Exceptional 95.6% |
| Delaware | 98.4 /100 | #97 | Exceptional 95.6% |
| Immigrants | Japan | 98.4 /100 | #98 | Exceptional 95.6% |
| Menominee | 98.3 /100 | #99 | Exceptional 95.6% |
| Lebanese | 98.1 /100 | #100 | Exceptional 95.6% |
| Immigrants | Moldova | 97.9 /100 | #101 | Exceptional 95.5% |
| Immigrants | Switzerland | 97.7 /100 | #102 | Exceptional 95.5% |