Haitian vs Immigrants from England Doctorate Degree

COMPARE

Haitian
Race
Ancestry
AfghanAfricanAlaska NativeAlaskan AthabascanAlbanianAleutAlsatianAmericanApacheArabArapahoArgentineanArmenianAssyrian/Chaldean/SyriacAustralianAustrianBahamianBangladeshiBarbadianBasqueBelgianBelizeanBermudanBhutaneseBlackfeetBolivianBrazilianBritishBritish West IndianBulgarianBurmeseCajunCambodianCanadianCape VerdeanCarpatho RusynCelticCentral AmericanCentral American IndianCherokeeCheyenneChickasawChileanChineseChippewaChoctawColombianColvilleComancheCosta RicanCreeCreekCroatianCrowCubanCypriotCzechCzechoslovakianDanishDelawareDominicanDutchDutch West IndianEastern EuropeanEcuadorianEgyptianEnglishEstonianEthiopianEuropeanFijianFilipinoFinnishFrenchFrench American IndianFrench CanadianGermanGerman RussianGhanaianGreekGuamanian/ChamorroGuatemalanGuyaneseHaitianHmongHonduranHopiHoumaHungarianIcelanderIndian (Asian)IndonesianInupiatIranianIraqiIrishIroquoisIsraeliItalianJamaicanJapaneseJordanianKenyanKiowaKoreanLaotianLatvianLebaneseLiberianLithuanianLumbeeLuxembourgerMacedonianMalaysianMalteseMarshalleseMenomineeMexicanMexican American IndianMongolianMoroccanNative HawaiianNavajoNepaleseNew ZealanderNicaraguanNigerianNorthern EuropeanNorwegianOkinawanOsageOttawaPaiutePakistaniPalestinianPanamanianParaguayanPennsylvania GermanPeruvianPimaPolishPortuguesePotawatomiPuebloPuerto RicanPuget Sound SalishRomanianRussianSalvadoranSamoanScandinavianScotch-IrishScottishSeminoleSenegaleseSerbianShoshoneSierra LeoneanSiouxSlavicSlovakSloveneSomaliSouth AfricanSouth AmericanSouth American IndianSoviet UnionSpaniardSpanishSpanish AmericanSpanish American IndianSri LankanSubsaharan AfricanSudaneseSwedishSwissSyrianTaiwaneseThaiTlingit-HaidaTohono O'OdhamTonganTrinidadian and TobagonianTsimshianTurkishU.S. Virgin IslanderUgandanUkrainianUruguayanUteVenezuelanVietnameseWelshWest IndianYakamaYaquiYugoslavianYumanYup'ikZimbabwean
Immigration
NonimmigrantsImmigrantsAfghanistanAfricaAlbaniaArgentinaArmeniaAsiaAustraliaAustriaBahamasBangladeshBarbadosBelarusBelgiumBelizeBoliviaBosnia and HerzegovinaBrazilBulgariaBurma/MyanmarCabo VerdeCambodiaCameroonCanadaCaribbeanCentral AmericaChileChinaColombiaCongoCosta RicaCroatiaCubaCzechoslovakiaDenmarkDominicaDominican RepublicEastern AfricaEastern AsiaEastern EuropeEcuadorEgyptEl SalvadorEritreaEthiopiaEuropeFijiFranceGermanyGhanaGreeceGrenadaGuatemalaGuyanaHaitiHondurasHong KongHungaryIndiaIndonesiaIranIraqIrelandIsraelItalyJamaicaJapanJordanKazakhstanKenyaKoreaKuwaitLaosLatin AmericaLatviaLebanonLiberiaLithuaniaMalaysiaMexicoMicronesiaMiddle AfricaMoldovaMoroccoNepalNetherlandsNicaraguaNigeriaNorth AmericaNorth MacedoniaNorthern AfricaNorthern EuropeNorwayOceaniaPakistanPanamaPeruPhilippinesPolandPortugalRomaniaRussiaSaudi ArabiaScotlandSenegalSerbiaSierra LeoneSingaporeSomaliaSouth AfricaSouth AmericaSouth Central AsiaSouth Eastern AsiaSouthern EuropeSpainSri LankaSt. Vincent and the GrenadinesSudanSwedenSwitzerlandSyriaTaiwanThailandTrinidad and TobagoTurkeyUgandaUkraineUruguayUzbekistanVenezuelaVietnamWest IndiesWestern AfricaWestern AsiaWestern EuropeYemenZaireZimbabweAzores
Immigrants from England
Race
Ancestry
AfghanAfricanAlaska NativeAlaskan AthabascanAlbanianAleutAlsatianAmericanApacheArabArapahoArgentineanArmenianAssyrian/Chaldean/SyriacAustralianAustrianBahamianBangladeshiBarbadianBasqueBelgianBelizeanBermudanBhutaneseBlackfeetBolivianBrazilianBritishBritish West IndianBulgarianBurmeseCajunCambodianCanadianCape VerdeanCarpatho RusynCelticCentral AmericanCentral American IndianCherokeeCheyenneChickasawChileanChineseChippewaChoctawColombianColvilleComancheCosta RicanCreeCreekCroatianCrowCubanCypriotCzechCzechoslovakianDanishDelawareDominicanDutchDutch West IndianEastern EuropeanEcuadorianEgyptianEnglishEstonianEthiopianEuropeanFijianFilipinoFinnishFrenchFrench American IndianFrench CanadianGermanGerman RussianGhanaianGreekGuamanian/ChamorroGuatemalanGuyaneseHmongHonduranHopiHoumaHungarianIcelanderIndian (Asian)IndonesianInupiatIranianIraqiIrishIroquoisIsraeliItalianJamaicanJapaneseJordanianKenyanKiowaKoreanLaotianLatvianLebaneseLiberianLithuanianLumbeeLuxembourgerMacedonianMalaysianMalteseMarshalleseMenomineeMexicanMexican American IndianMongolianMoroccanNative HawaiianNavajoNepaleseNew ZealanderNicaraguanNigerianNorthern EuropeanNorwegianOkinawanOsageOttawaPaiutePakistaniPalestinianPanamanianParaguayanPennsylvania GermanPeruvianPimaPolishPortuguesePotawatomiPuebloPuerto RicanPuget Sound SalishRomanianRussianSalvadoranSamoanScandinavianScotch-IrishScottishSeminoleSenegaleseSerbianShoshoneSierra LeoneanSiouxSlavicSlovakSloveneSomaliSouth AfricanSouth AmericanSouth American IndianSoviet UnionSpaniardSpanishSpanish AmericanSpanish American IndianSri LankanSubsaharan AfricanSudaneseSwedishSwissSyrianTaiwaneseThaiTlingit-HaidaTohono O'OdhamTonganTrinidadian and TobagonianTsimshianTurkishU.S. Virgin IslanderUgandanUkrainianUruguayanUteVenezuelanVietnameseWelshWest IndianYakamaYaquiYugoslavianYumanYup'ikZimbabwean
Immigration
NonimmigrantsImmigrantsAfghanistanAfricaAlbaniaArgentinaArmeniaAsiaAustraliaAustriaBahamasBangladeshBarbadosBelarusBelgiumBelizeBoliviaBosnia and HerzegovinaBrazilBulgariaBurma/MyanmarCabo VerdeCambodiaCameroonCanadaCaribbeanCentral AmericaChileChinaColombiaCongoCosta RicaCroatiaCubaCzechoslovakiaDenmarkDominicaDominican RepublicEastern AfricaEastern AsiaEastern EuropeEcuadorEgyptEl SalvadorEnglandEritreaEthiopiaEuropeFijiFranceGermanyGhanaGreeceGrenadaGuatemalaGuyanaHaitiHondurasHong KongHungaryIndiaIndonesiaIranIraqIrelandIsraelItalyJamaicaJapanJordanKazakhstanKenyaKoreaKuwaitLaosLatin AmericaLatviaLebanonLiberiaLithuaniaMalaysiaMexicoMicronesiaMiddle AfricaMoldovaMoroccoNepalNetherlandsNicaraguaNigeriaNorth AmericaNorth MacedoniaNorthern AfricaNorthern EuropeNorwayOceaniaPakistanPanamaPeruPhilippinesPolandPortugalRomaniaRussiaSaudi ArabiaScotlandSenegalSerbiaSierra LeoneSingaporeSomaliaSouth AfricaSouth AmericaSouth Central AsiaSouth Eastern AsiaSouthern EuropeSpainSri LankaSt. Vincent and the GrenadinesSudanSwedenSwitzerlandSyriaTaiwanThailandTrinidad and TobagoTurkeyUgandaUkraineUruguayUzbekistanVenezuelaVietnamWest IndiesWestern AfricaWestern AsiaWestern EuropeYemenZaireZimbabweAzores
Doctorate Degree
Income
Poverty
Unemployment
Labor Participation
Family Structure
Vehicle Availability
Education Level
Disability

Doctorate Degree Comparison

Haitians

Immigrants from England

Tragic
Exceptional
1.3%
DOCTORATE DEGREE
0.0/ 100
METRIC RATING
329th/ 347
METRIC RANK
2.2%
DOCTORATE DEGREE
99.6/ 100
METRIC RATING
84th/ 347
METRIC RANK

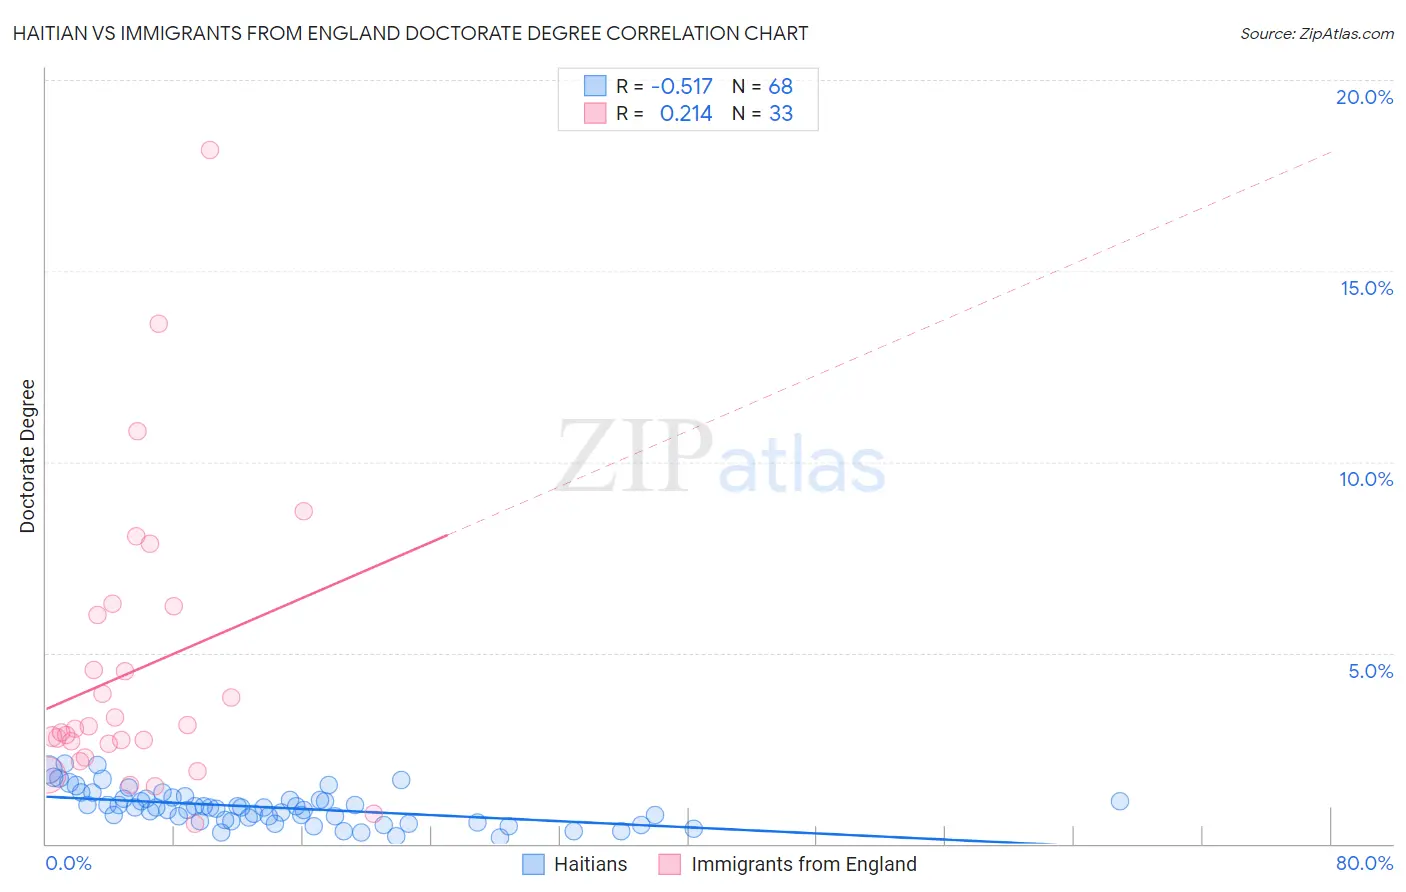
Haitian vs Immigrants from England Doctorate Degree Correlation Chart

The statistical analysis conducted on geographies consisting of 285,866,537 people shows a substantial negative correlation between the proportion of Haitians and percentage of population with at least doctorate degree education in the United States with a correlation coefficient (R) of -0.517 and weighted average of 1.3%. Similarly, the statistical analysis conducted on geographies consisting of 388,548,002 people shows a weak positive correlation between the proportion of Immigrants from England and percentage of population with at least doctorate degree education in the United States with a correlation coefficient (R) of 0.214 and weighted average of 2.2%, a difference of 68.9%.
Haitian vs Immigrants from England Doctorate Degree

Doctorate Degree Correlation Summary

MeasurementHaitianImmigrants from England
Minimum0.17%0.53%
Maximum2.1%18.2%
Range1.9%17.7%
Mean0.95%4.5%
Median0.95%3.0%
Interquartile 25% (IQ1)0.60%2.4%
Interquartile 75% (IQ3)1.2%6.1%
Interquartile Range (IQR)0.58%3.7%
Standard Deviation (Sample)0.45%3.8%
Standard Deviation (Population)0.45%3.8%

Similar Demographics by Doctorate Degree

Demographics Similar to Haitians by Doctorate Degree

In terms of doctorate degree, the demographic groups most similar to Haitians are Inupiat (1.3%, a difference of 0.050%), Yup'ik (1.3%, a difference of 0.22%), Immigrants from Latin America (1.3%, a difference of 0.23%), Hispanic or Latino (1.3%, a difference of 0.63%), and Immigrants from Cabo Verde (1.3%, a difference of 0.92%).
DemographicsRating | RankDoctorate Degree
Seminole
0.1
/100
|
#322
Tragic
1.3%
Immigrants | Belize
0.1
/100
|
#323
Tragic
1.3%
Natives/Alaskans
0.0
/100
|
#324
Tragic
1.3%
Pima
0.0
/100
|
#325
Tragic
1.3%
Immigrants | Cabo Verde
0.0
/100
|
#326
Tragic
1.3%
Hispanics or Latinos
0.0
/100
|
#327
Tragic
1.3%
Inupiat
0.0
/100
|
#328
Tragic
1.3%
Haitians
0.0
/100
|
#329
Tragic
1.3%
Yup'ik
0.0
/100
|
#330
Tragic
1.3%
Immigrants | Latin America
0.0
/100
|
#331
Tragic
1.3%
Yakama
0.0
/100
|
#332
Tragic
1.3%
Immigrants | Caribbean
0.0
/100
|
#333
Tragic
1.3%
Immigrants | Dominican Republic
0.0
/100
|
#334
Tragic
1.3%
Immigrants | Haiti
0.0
/100
|
#335
Tragic
1.3%
Nepalese
0.0
/100
|
#336
Tragic
1.3%

Demographics Similar to Immigrants from England by Doctorate Degree

In terms of doctorate degree, the demographic groups most similar to Immigrants from England are Immigrants from Brazil (2.2%, a difference of 0.13%), Immigrants from Lithuania (2.2%, a difference of 0.14%), Immigrants from Uganda (2.2%, a difference of 0.32%), Egyptian (2.2%, a difference of 0.83%), and Immigrants from Argentina (2.2%, a difference of 0.86%).
DemographicsRating | RankDoctorate Degree
Immigrants | Lebanon
99.8
/100
|
#77
Exceptional
2.2%
Immigrants | Belarus
99.7
/100
|
#78
Exceptional
2.2%
Northern Europeans
99.7
/100
|
#79
Exceptional
2.2%
Ugandans
99.7
/100
|
#80
Exceptional
2.2%
Immigrants | Argentina
99.7
/100
|
#81
Exceptional
2.2%
Immigrants | Uganda
99.6
/100
|
#82
Exceptional
2.2%
Immigrants | Lithuania
99.6
/100
|
#83
Exceptional
2.2%
Immigrants | England
99.6
/100
|
#84
Exceptional
2.2%
Immigrants | Brazil
99.6
/100
|
#85
Exceptional
2.2%
Egyptians
99.4
/100
|
#86
Exceptional
2.2%
Immigrants | Zimbabwe
99.4
/100
|
#87
Exceptional
2.2%
Immigrants | Nepal
99.3
/100
|
#88
Exceptional
2.2%
British
99.3
/100
|
#89
Exceptional
2.2%
Immigrants | Scotland
99.2
/100
|
#90
Exceptional
2.2%
Immigrants | Sudan
99.1
/100
|
#91
Exceptional
2.2%