Guyanese vs Immigrants from Iraq 4th Grade
COMPARE
Guyanese
Immigrants from Iraq
4th Grade
4th Grade Comparison
Guyanese
Immigrants from Iraq
96.4%
4TH GRADE
0.0/ 100
METRIC RATING
303rd/ 347
METRIC RANK
97.2%
4TH GRADE
4.6/ 100
METRIC RATING
225th/ 347
METRIC RANK
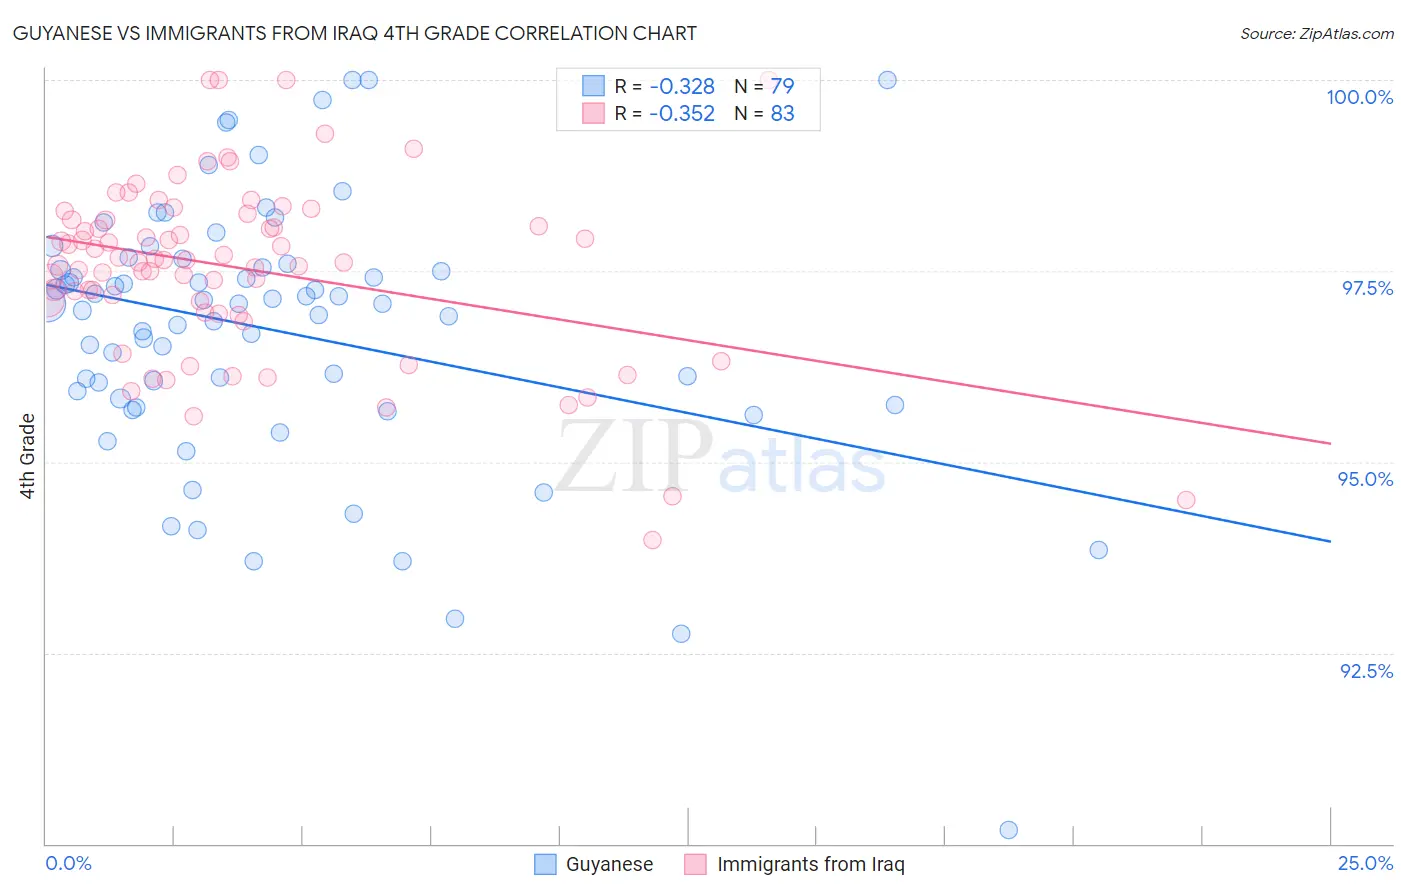
Guyanese vs Immigrants from Iraq 4th Grade Correlation Chart
The statistical analysis conducted on geographies consisting of 176,921,765 people shows a mild negative correlation between the proportion of Guyanese and percentage of population with at least 4th grade education in the United States with a correlation coefficient (R) of -0.328 and weighted average of 96.4%. Similarly, the statistical analysis conducted on geographies consisting of 194,632,332 people shows a mild negative correlation between the proportion of Immigrants from Iraq and percentage of population with at least 4th grade education in the United States with a correlation coefficient (R) of -0.352 and weighted average of 97.2%, a difference of 0.88%.
4th Grade Correlation Summary
| Measurement | Guyanese | Immigrants from Iraq |
| Minimum | 90.2% | 94.0% |
| Maximum | 100.0% | 100.0% |
| Range | 9.8% | 6.0% |
| Mean | 96.7% | 97.5% |
| Median | 97.1% | 97.6% |
| Interquartile 25% (IQ1) | 95.8% | 97.0% |
| Interquartile 75% (IQ3) | 97.6% | 98.2% |
| Interquartile Range (IQR) | 1.8% | 1.2% |
| Standard Deviation (Sample) | 1.7% | 1.2% |
| Standard Deviation (Population) | 1.7% | 1.2% |
Similar Demographics by 4th Grade
Demographics Similar to Guyanese by 4th Grade
In terms of 4th grade, the demographic groups most similar to Guyanese are Ecuadorian (96.4%, a difference of 0.010%), Immigrants from Caribbean (96.4%, a difference of 0.030%), Sri Lankan (96.4%, a difference of 0.040%), Immigrants from Cuba (96.4%, a difference of 0.050%), and Immigrants from Haiti (96.3%, a difference of 0.070%).
| Demographics | Rating | Rank | 4th Grade |
| Somalis | 0.0 /100 | #296 | Tragic 96.6% |
| Immigrants | Somalia | 0.0 /100 | #297 | Tragic 96.5% |
| Haitians | 0.0 /100 | #298 | Tragic 96.5% |
| Immigrants | Dominica | 0.0 /100 | #299 | Tragic 96.5% |
| Immigrants | South Eastern Asia | 0.0 /100 | #300 | Tragic 96.5% |
| Immigrants | Immigrants | 0.0 /100 | #301 | Tragic 96.5% |
| Immigrants | Cuba | 0.0 /100 | #302 | Tragic 96.4% |
| Guyanese | 0.0 /100 | #303 | Tragic 96.4% |
| Ecuadorians | 0.0 /100 | #304 | Tragic 96.4% |
| Immigrants | Caribbean | 0.0 /100 | #305 | Tragic 96.4% |
| Sri Lankans | 0.0 /100 | #306 | Tragic 96.4% |
| Immigrants | Haiti | 0.0 /100 | #307 | Tragic 96.3% |
| Immigrants | Laos | 0.0 /100 | #308 | Tragic 96.3% |
| Immigrants | Guyana | 0.0 /100 | #309 | Tragic 96.3% |
| Immigrants | Burma/Myanmar | 0.0 /100 | #310 | Tragic 96.3% |
Demographics Similar to Immigrants from Iraq by 4th Grade
In terms of 4th grade, the demographic groups most similar to Immigrants from Iraq are Immigrants from Lebanon (97.3%, a difference of 0.010%), Immigrants from Sudan (97.2%, a difference of 0.010%), Immigrants from Syria (97.2%, a difference of 0.010%), Tongan (97.3%, a difference of 0.020%), and South American Indian (97.3%, a difference of 0.020%).
| Demographics | Rating | Rank | 4th Grade |
| Iraqis | 6.3 /100 | #218 | Tragic 97.3% |
| Tongans | 5.8 /100 | #219 | Tragic 97.3% |
| South American Indians | 5.5 /100 | #220 | Tragic 97.3% |
| Immigrants | Panama | 5.4 /100 | #221 | Tragic 97.3% |
| Immigrants | Lebanon | 5.1 /100 | #222 | Tragic 97.3% |
| Immigrants | Sudan | 5.0 /100 | #223 | Tragic 97.2% |
| Immigrants | Syria | 5.0 /100 | #224 | Tragic 97.2% |
| Immigrants | Iraq | 4.6 /100 | #225 | Tragic 97.2% |
| Bahamians | 3.8 /100 | #226 | Tragic 97.2% |
| Immigrants | Pakistan | 3.7 /100 | #227 | Tragic 97.2% |
| Sub-Saharan Africans | 3.6 /100 | #228 | Tragic 97.2% |
| Liberians | 3.6 /100 | #229 | Tragic 97.2% |
| Uruguayans | 3.5 /100 | #230 | Tragic 97.2% |
| Immigrants | Malaysia | 3.4 /100 | #231 | Tragic 97.2% |
| Immigrants | Western Asia | 3.4 /100 | #232 | Tragic 97.2% |