Guyanese vs Immigrants from Northern Europe 4th Grade
COMPARE
Guyanese
Immigrants from Northern Europe
4th Grade
4th Grade Comparison
Guyanese
Immigrants from Northern Europe
96.4%
4TH GRADE
0.0/ 100
METRIC RATING
303rd/ 347
METRIC RANK
98.0%
4TH GRADE
99.6/ 100
METRIC RATING
65th/ 347
METRIC RANK
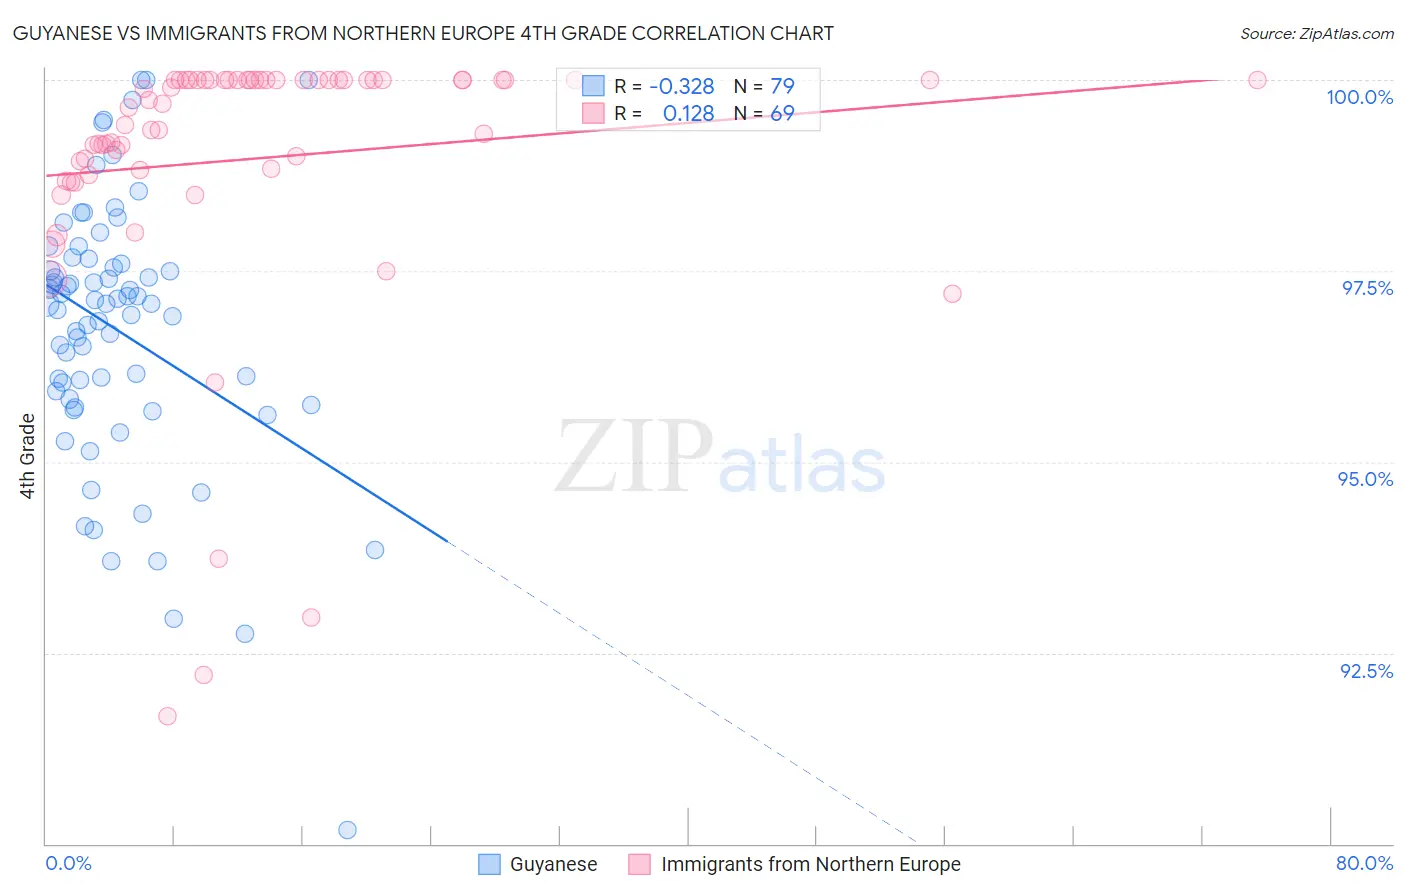
Guyanese vs Immigrants from Northern Europe 4th Grade Correlation Chart
The statistical analysis conducted on geographies consisting of 176,921,765 people shows a mild negative correlation between the proportion of Guyanese and percentage of population with at least 4th grade education in the United States with a correlation coefficient (R) of -0.328 and weighted average of 96.4%. Similarly, the statistical analysis conducted on geographies consisting of 477,226,800 people shows a poor positive correlation between the proportion of Immigrants from Northern Europe and percentage of population with at least 4th grade education in the United States with a correlation coefficient (R) of 0.128 and weighted average of 98.0%, a difference of 1.7%.
4th Grade Correlation Summary
| Measurement | Guyanese | Immigrants from Northern Europe |
| Minimum | 90.2% | 91.7% |
| Maximum | 100.0% | 100.0% |
| Range | 9.8% | 8.3% |
| Mean | 96.7% | 99.0% |
| Median | 97.1% | 99.7% |
| Interquartile 25% (IQ1) | 95.8% | 98.8% |
| Interquartile 75% (IQ3) | 97.6% | 100.0% |
| Interquartile Range (IQR) | 1.8% | 1.2% |
| Standard Deviation (Sample) | 1.7% | 1.8% |
| Standard Deviation (Population) | 1.7% | 1.8% |
Similar Demographics by 4th Grade
Demographics Similar to Guyanese by 4th Grade
In terms of 4th grade, the demographic groups most similar to Guyanese are Ecuadorian (96.4%, a difference of 0.010%), Immigrants from Caribbean (96.4%, a difference of 0.030%), Sri Lankan (96.4%, a difference of 0.040%), Immigrants from Cuba (96.4%, a difference of 0.050%), and Immigrants from Haiti (96.3%, a difference of 0.070%).
| Demographics | Rating | Rank | 4th Grade |
| Somalis | 0.0 /100 | #296 | Tragic 96.6% |
| Immigrants | Somalia | 0.0 /100 | #297 | Tragic 96.5% |
| Haitians | 0.0 /100 | #298 | Tragic 96.5% |
| Immigrants | Dominica | 0.0 /100 | #299 | Tragic 96.5% |
| Immigrants | South Eastern Asia | 0.0 /100 | #300 | Tragic 96.5% |
| Immigrants | Immigrants | 0.0 /100 | #301 | Tragic 96.5% |
| Immigrants | Cuba | 0.0 /100 | #302 | Tragic 96.4% |
| Guyanese | 0.0 /100 | #303 | Tragic 96.4% |
| Ecuadorians | 0.0 /100 | #304 | Tragic 96.4% |
| Immigrants | Caribbean | 0.0 /100 | #305 | Tragic 96.4% |
| Sri Lankans | 0.0 /100 | #306 | Tragic 96.4% |
| Immigrants | Haiti | 0.0 /100 | #307 | Tragic 96.3% |
| Immigrants | Laos | 0.0 /100 | #308 | Tragic 96.3% |
| Immigrants | Guyana | 0.0 /100 | #309 | Tragic 96.3% |
| Immigrants | Burma/Myanmar | 0.0 /100 | #310 | Tragic 96.3% |
Demographics Similar to Immigrants from Northern Europe by 4th Grade
In terms of 4th grade, the demographic groups most similar to Immigrants from Northern Europe are Cajun (98.0%, a difference of 0.0%), Canadian (98.0%, a difference of 0.0%), New Zealander (98.0%, a difference of 0.0%), Russian (98.0%, a difference of 0.010%), and Kiowa (98.0%, a difference of 0.010%).
| Demographics | Rating | Rank | 4th Grade |
| Creek | 99.8 /100 | #58 | Exceptional 98.1% |
| Americans | 99.8 /100 | #59 | Exceptional 98.1% |
| Immigrants | Canada | 99.7 /100 | #60 | Exceptional 98.1% |
| Immigrants | North America | 99.7 /100 | #61 | Exceptional 98.1% |
| Serbians | 99.7 /100 | #62 | Exceptional 98.1% |
| Russians | 99.7 /100 | #63 | Exceptional 98.0% |
| Cajuns | 99.7 /100 | #64 | Exceptional 98.0% |
| Immigrants | Northern Europe | 99.6 /100 | #65 | Exceptional 98.0% |
| Canadians | 99.6 /100 | #66 | Exceptional 98.0% |
| New Zealanders | 99.6 /100 | #67 | Exceptional 98.0% |
| Kiowa | 99.6 /100 | #68 | Exceptional 98.0% |
| Pueblo | 99.6 /100 | #69 | Exceptional 98.0% |
| Immigrants | Austria | 99.6 /100 | #70 | Exceptional 98.0% |
| Lumbee | 99.6 /100 | #71 | Exceptional 98.0% |
| Iranians | 99.4 /100 | #72 | Exceptional 98.0% |