Guatemalan vs Comanche 5th Grade
COMPARE
Guatemalan
Comanche
5th Grade
5th Grade Comparison
Guatemalans
Comanche
94.8%
5TH GRADE
0.0/ 100
METRIC RATING
340th/ 347
METRIC RANK
97.3%
5TH GRADE
42.1/ 100
METRIC RATING
178th/ 347
METRIC RANK
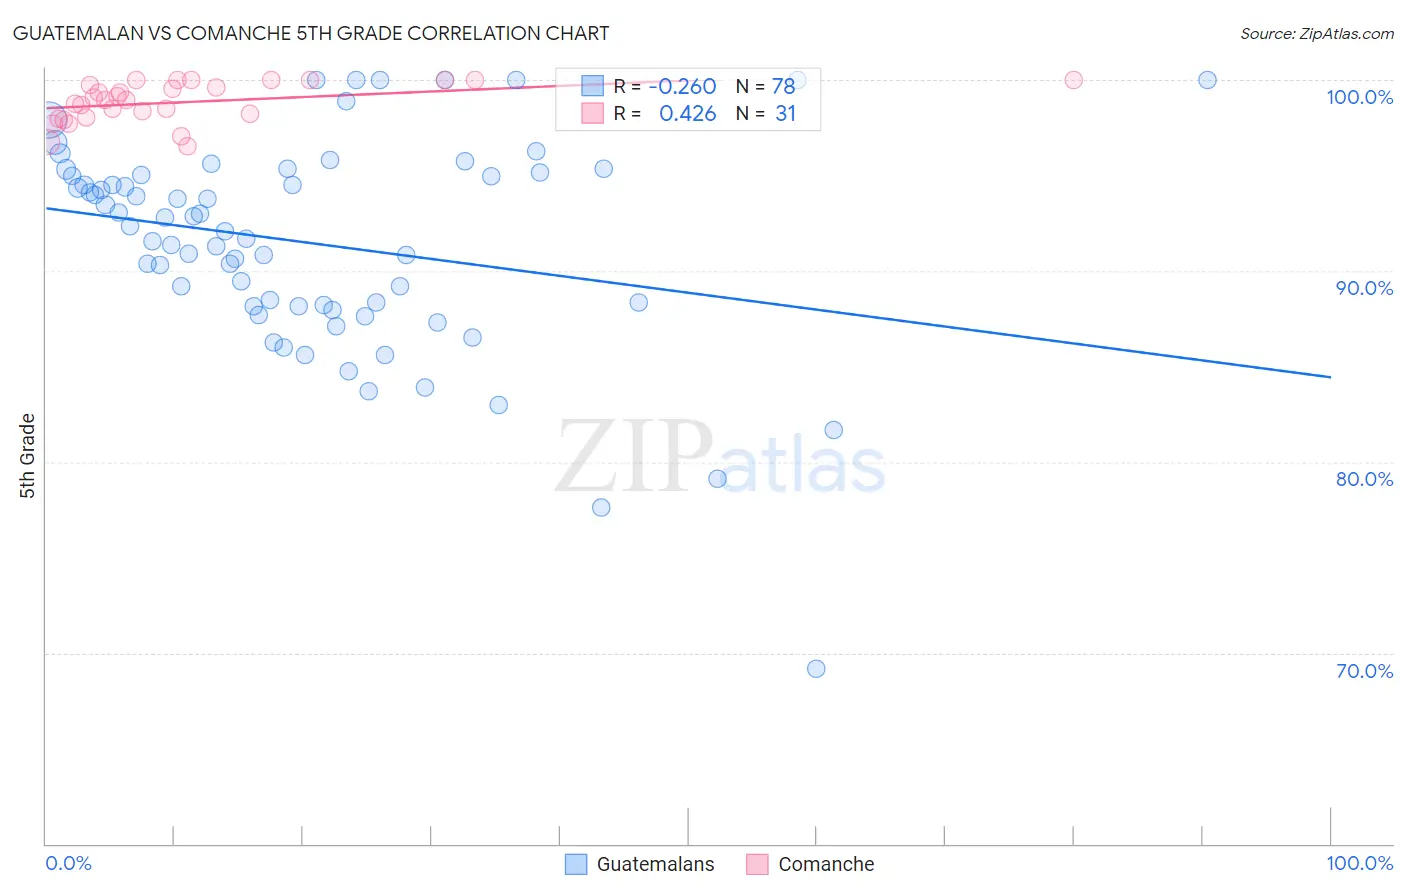
Guatemalan vs Comanche 5th Grade Correlation Chart
The statistical analysis conducted on geographies consisting of 409,566,469 people shows a weak negative correlation between the proportion of Guatemalans and percentage of population with at least 5th grade education in the United States with a correlation coefficient (R) of -0.260 and weighted average of 94.8%. Similarly, the statistical analysis conducted on geographies consisting of 109,786,530 people shows a moderate positive correlation between the proportion of Comanche and percentage of population with at least 5th grade education in the United States with a correlation coefficient (R) of 0.426 and weighted average of 97.3%, a difference of 2.6%.
5th Grade Correlation Summary
| Measurement | Guatemalan | Comanche |
| Minimum | 69.2% | 96.5% |
| Maximum | 100.0% | 100.0% |
| Range | 30.8% | 3.5% |
| Mean | 91.5% | 98.8% |
| Median | 92.2% | 99.0% |
| Interquartile 25% (IQ1) | 88.2% | 98.0% |
| Interquartile 75% (IQ3) | 95.0% | 100.0% |
| Interquartile Range (IQR) | 6.8% | 2.0% |
| Standard Deviation (Sample) | 5.6% | 1.0% |
| Standard Deviation (Population) | 5.6% | 1.0% |
Similar Demographics by 5th Grade
Demographics Similar to Guatemalans by 5th Grade
In terms of 5th grade, the demographic groups most similar to Guatemalans are Immigrants from Yemen (94.9%, a difference of 0.030%), Immigrants from Cabo Verde (94.9%, a difference of 0.070%), Yakama (94.8%, a difference of 0.080%), Immigrants from Central America (94.7%, a difference of 0.18%), and Central American (95.1%, a difference of 0.23%).
| Demographics | Rating | Rank | 5th Grade |
| Immigrants | Latin America | 0.0 /100 | #333 | Tragic 95.3% |
| Nepalese | 0.0 /100 | #334 | Tragic 95.2% |
| Mexicans | 0.0 /100 | #335 | Tragic 95.2% |
| Immigrants | Azores | 0.0 /100 | #336 | Tragic 95.1% |
| Central Americans | 0.0 /100 | #337 | Tragic 95.1% |
| Immigrants | Cabo Verde | 0.0 /100 | #338 | Tragic 94.9% |
| Immigrants | Yemen | 0.0 /100 | #339 | Tragic 94.9% |
| Guatemalans | 0.0 /100 | #340 | Tragic 94.8% |
| Yakama | 0.0 /100 | #341 | Tragic 94.8% |
| Immigrants | Central America | 0.0 /100 | #342 | Tragic 94.7% |
| Salvadorans | 0.0 /100 | #343 | Tragic 94.6% |
| Immigrants | Mexico | 0.0 /100 | #344 | Tragic 94.6% |
| Immigrants | Guatemala | 0.0 /100 | #345 | Tragic 94.6% |
| Immigrants | El Salvador | 0.0 /100 | #346 | Tragic 94.3% |
| Spanish American Indians | 0.0 /100 | #347 | Tragic 94.2% |
Demographics Similar to Comanche by 5th Grade
In terms of 5th grade, the demographic groups most similar to Comanche are Immigrants from Kenya (97.3%, a difference of 0.010%), Pakistani (97.3%, a difference of 0.010%), Argentinean (97.3%, a difference of 0.010%), Mongolian (97.3%, a difference of 0.010%), and Immigrants from Spain (97.3%, a difference of 0.020%).
| Demographics | Rating | Rank | 5th Grade |
| Immigrants | Sri Lanka | 53.8 /100 | #171 | Average 97.3% |
| Arabs | 53.4 /100 | #172 | Average 97.3% |
| Egyptians | 52.4 /100 | #173 | Average 97.3% |
| Immigrants | Kazakhstan | 50.0 /100 | #174 | Average 97.3% |
| Immigrants | Micronesia | 48.8 /100 | #175 | Average 97.3% |
| Immigrants | Taiwan | 48.4 /100 | #176 | Average 97.3% |
| Immigrants | Spain | 47.0 /100 | #177 | Average 97.3% |
| Comanche | 42.1 /100 | #178 | Average 97.3% |
| Immigrants | Kenya | 40.3 /100 | #179 | Average 97.3% |
| Pakistanis | 40.2 /100 | #180 | Average 97.3% |
| Argentineans | 39.5 /100 | #181 | Fair 97.3% |
| Mongolians | 39.4 /100 | #182 | Fair 97.3% |
| Immigrants | Ukraine | 38.6 /100 | #183 | Fair 97.3% |
| Immigrants | Venezuela | 38.4 /100 | #184 | Fair 97.3% |
| Dutch West Indians | 36.2 /100 | #185 | Fair 97.3% |