Guatemalan vs Okinawan Bachelor's Degree
COMPARE
Guatemalan
Okinawan
Bachelor's Degree
Bachelor's Degree Comparison
Guatemalans
Okinawans
31.0%
BACHELOR'S DEGREE
0.1/ 100
METRIC RATING
288th/ 347
METRIC RANK
50.5%
BACHELOR'S DEGREE
100.0/ 100
METRIC RATING
6th/ 347
METRIC RANK
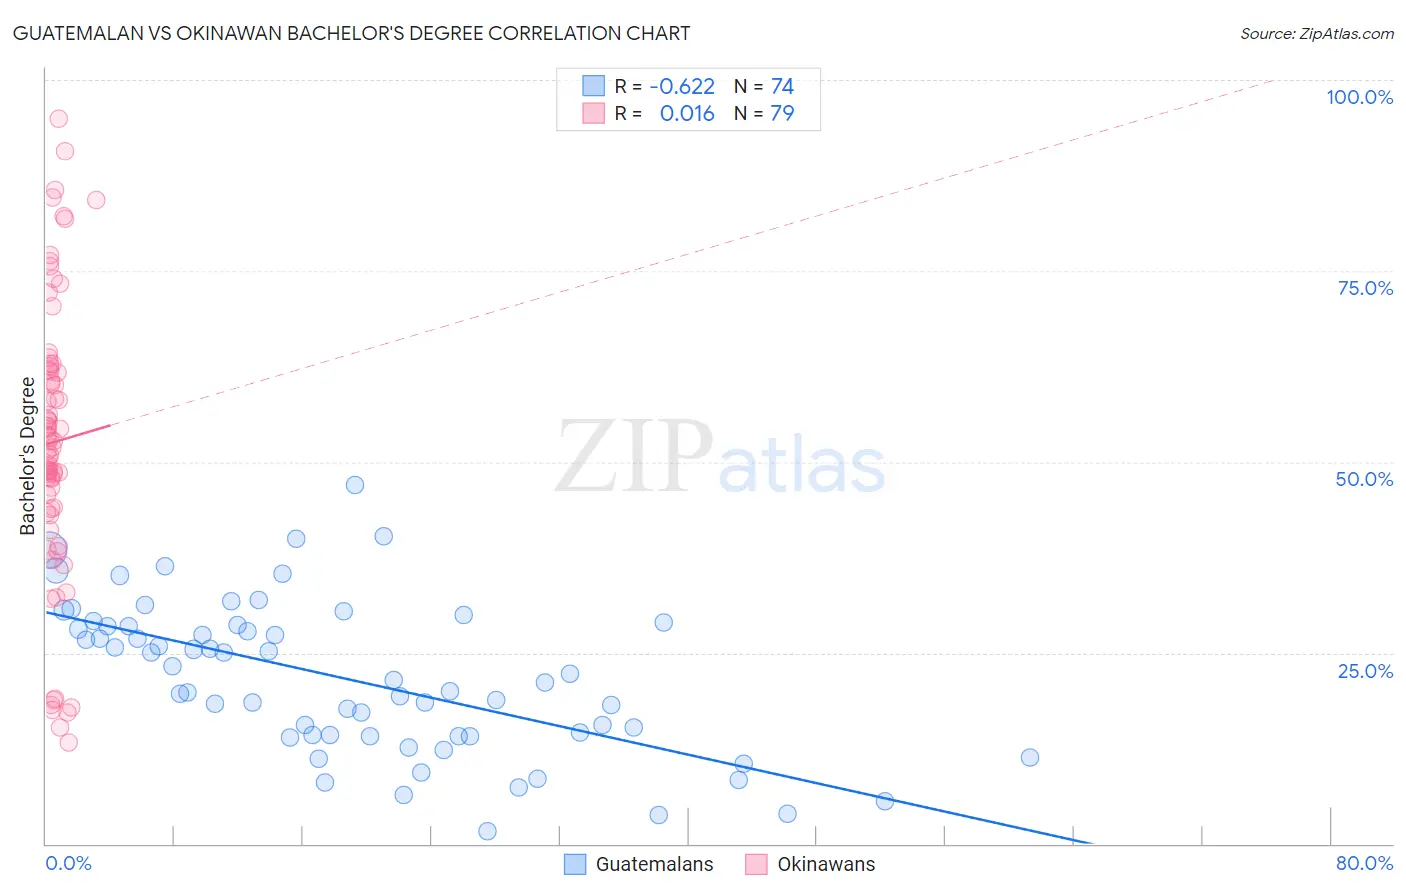
Guatemalan vs Okinawan Bachelor's Degree Correlation Chart
The statistical analysis conducted on geographies consisting of 409,514,528 people shows a significant negative correlation between the proportion of Guatemalans and percentage of population with at least bachelor's degree education in the United States with a correlation coefficient (R) of -0.622 and weighted average of 31.0%. Similarly, the statistical analysis conducted on geographies consisting of 73,779,368 people shows no correlation between the proportion of Okinawans and percentage of population with at least bachelor's degree education in the United States with a correlation coefficient (R) of 0.016 and weighted average of 50.5%, a difference of 63.0%.
Bachelor's Degree Correlation Summary
| Measurement | Guatemalan | Okinawan |
| Minimum | 1.7% | 13.3% |
| Maximum | 47.0% | 95.0% |
| Range | 45.3% | 81.7% |
| Mean | 21.6% | 52.6% |
| Median | 21.3% | 52.8% |
| Interquartile 25% (IQ1) | 14.1% | 43.9% |
| Interquartile 75% (IQ3) | 28.5% | 62.1% |
| Interquartile Range (IQR) | 14.3% | 18.2% |
| Standard Deviation (Sample) | 9.9% | 18.1% |
| Standard Deviation (Population) | 9.8% | 18.0% |
Similar Demographics by Bachelor's Degree
Demographics Similar to Guatemalans by Bachelor's Degree
In terms of bachelor's degree, the demographic groups most similar to Guatemalans are Puerto Rican (31.0%, a difference of 0.14%), Immigrants from Honduras (30.9%, a difference of 0.18%), Black/African American (30.9%, a difference of 0.22%), Ute (30.9%, a difference of 0.30%), and Ottawa (31.1%, a difference of 0.36%).
| Demographics | Rating | Rank | Bachelor's Degree |
| Blackfeet | 0.1 /100 | #281 | Tragic 31.5% |
| Immigrants | Caribbean | 0.1 /100 | #282 | Tragic 31.4% |
| Hondurans | 0.1 /100 | #283 | Tragic 31.3% |
| Haitians | 0.1 /100 | #284 | Tragic 31.3% |
| Aleuts | 0.1 /100 | #285 | Tragic 31.3% |
| Immigrants | El Salvador | 0.1 /100 | #286 | Tragic 31.3% |
| Ottawa | 0.1 /100 | #287 | Tragic 31.1% |
| Guatemalans | 0.1 /100 | #288 | Tragic 31.0% |
| Puerto Ricans | 0.1 /100 | #289 | Tragic 31.0% |
| Immigrants | Honduras | 0.1 /100 | #290 | Tragic 30.9% |
| Blacks/African Americans | 0.1 /100 | #291 | Tragic 30.9% |
| Ute | 0.1 /100 | #292 | Tragic 30.9% |
| Cape Verdeans | 0.1 /100 | #293 | Tragic 30.9% |
| Immigrants | Guatemala | 0.0 /100 | #294 | Tragic 30.8% |
| Immigrants | Dominican Republic | 0.0 /100 | #295 | Tragic 30.7% |
Demographics Similar to Okinawans by Bachelor's Degree
In terms of bachelor's degree, the demographic groups most similar to Okinawans are Immigrants from Iran (50.3%, a difference of 0.48%), Iranian (51.0%, a difference of 0.84%), Thai (50.1%, a difference of 0.85%), Immigrants from Israel (50.0%, a difference of 1.1%), and Immigrants from Taiwan (51.2%, a difference of 1.3%).
| Demographics | Rating | Rank | Bachelor's Degree |
| Filipinos | 100.0 /100 | #1 | Exceptional 52.7% |
| Immigrants | Singapore | 100.0 /100 | #2 | Exceptional 51.9% |
| Immigrants | India | 100.0 /100 | #3 | Exceptional 51.3% |
| Immigrants | Taiwan | 100.0 /100 | #4 | Exceptional 51.2% |
| Iranians | 100.0 /100 | #5 | Exceptional 51.0% |
| Okinawans | 100.0 /100 | #6 | Exceptional 50.5% |
| Immigrants | Iran | 100.0 /100 | #7 | Exceptional 50.3% |
| Thais | 100.0 /100 | #8 | Exceptional 50.1% |
| Immigrants | Israel | 100.0 /100 | #9 | Exceptional 50.0% |
| Cypriots | 100.0 /100 | #10 | Exceptional 49.0% |
| Immigrants | Australia | 100.0 /100 | #11 | Exceptional 48.5% |
| Immigrants | China | 100.0 /100 | #12 | Exceptional 48.4% |
| Immigrants | South Central Asia | 100.0 /100 | #13 | Exceptional 48.3% |
| Immigrants | Hong Kong | 100.0 /100 | #14 | Exceptional 48.2% |
| Immigrants | Eastern Asia | 100.0 /100 | #15 | Exceptional 48.1% |