Guamanian/Chamorro vs Immigrants from India No Schooling Completed
COMPARE
Guamanian/Chamorro
Immigrants from India
No Schooling Completed
No Schooling Completed Comparison
Guamanians/Chamorros
Immigrants from India
2.2%
NO SCHOOLING COMPLETED
29.8/ 100
METRIC RATING
192nd/ 347
METRIC RANK
1.7%
NO SCHOOLING COMPLETED
99.4/ 100
METRIC RATING
73rd/ 347
METRIC RANK
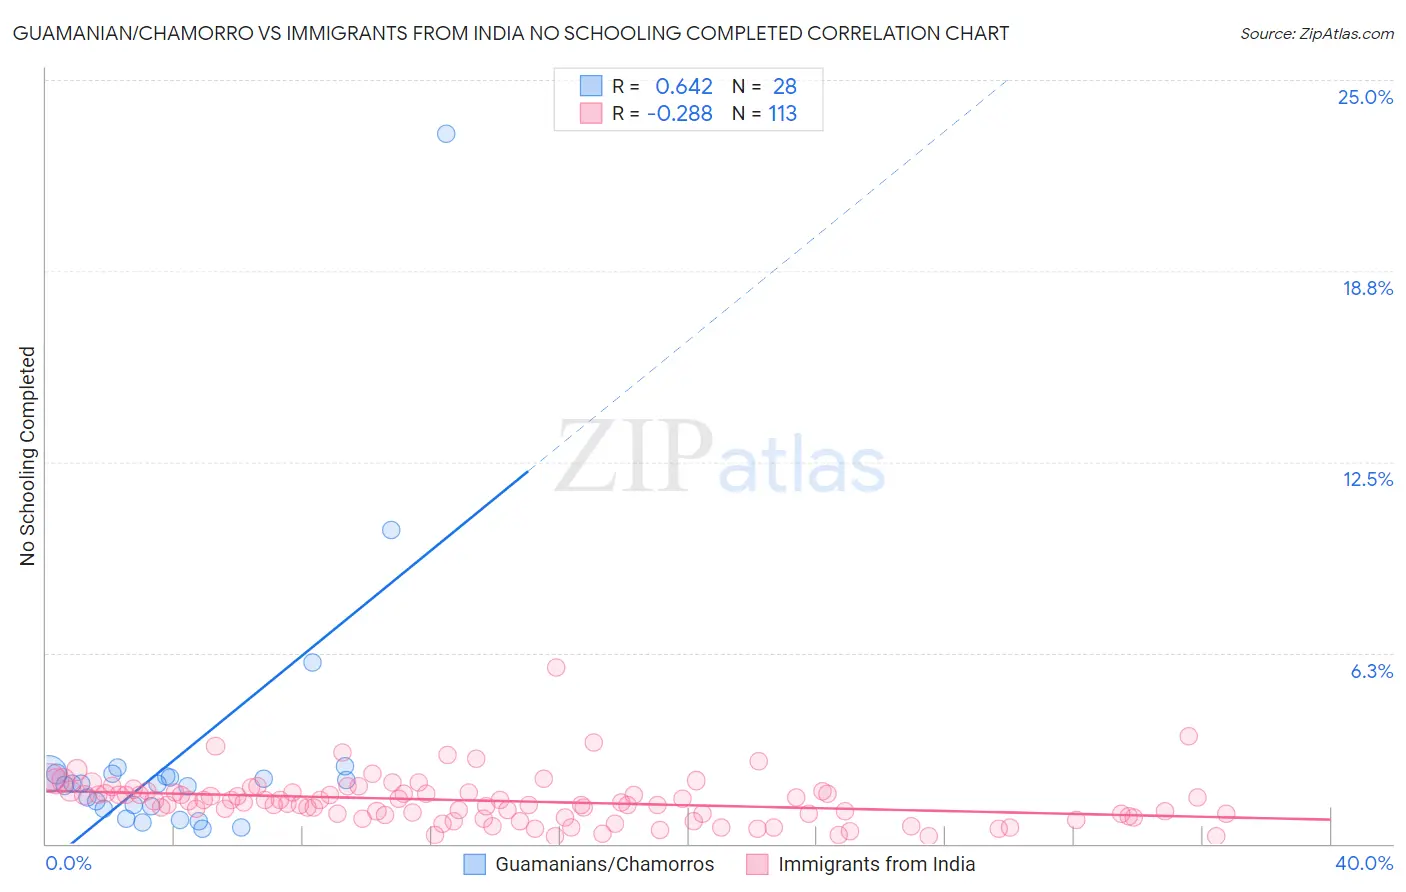
Guamanian/Chamorro vs Immigrants from India No Schooling Completed Correlation Chart
The statistical analysis conducted on geographies consisting of 220,951,365 people shows a significant positive correlation between the proportion of Guamanians/Chamorros and percentage of population with no schooling in the United States with a correlation coefficient (R) of 0.642 and weighted average of 2.2%. Similarly, the statistical analysis conducted on geographies consisting of 429,114,118 people shows a weak negative correlation between the proportion of Immigrants from India and percentage of population with no schooling in the United States with a correlation coefficient (R) of -0.288 and weighted average of 1.7%, a difference of 24.5%.
No Schooling Completed Correlation Summary
| Measurement | Guamanian/Chamorro | Immigrants from India |
| Minimum | 0.47% | 0.25% |
| Maximum | 23.2% | 5.8% |
| Range | 22.8% | 5.5% |
| Mean | 2.9% | 1.4% |
| Median | 2.0% | 1.4% |
| Interquartile 25% (IQ1) | 1.2% | 0.94% |
| Interquartile 75% (IQ3) | 2.3% | 1.7% |
| Interquartile Range (IQR) | 1.1% | 0.75% |
| Standard Deviation (Sample) | 4.4% | 0.79% |
| Standard Deviation (Population) | 4.3% | 0.78% |
Similar Demographics by No Schooling Completed
Demographics Similar to Guamanians/Chamorros by No Schooling Completed
In terms of no schooling completed, the demographic groups most similar to Guamanians/Chamorros are Paraguayan (2.2%, a difference of 0.080%), Bermudan (2.1%, a difference of 0.14%), Immigrants from Albania (2.2%, a difference of 0.24%), Spanish American (2.1%, a difference of 0.43%), and Hawaiian (2.2%, a difference of 0.44%).
| Demographics | Rating | Rank | No Schooling Completed |
| Mongolians | 40.8 /100 | #185 | Average 2.1% |
| Immigrants | Bosnia and Herzegovina | 38.6 /100 | #186 | Fair 2.1% |
| Navajo | 36.5 /100 | #187 | Fair 2.1% |
| Immigrants | Kenya | 36.2 /100 | #188 | Fair 2.1% |
| Immigrants | Egypt | 36.1 /100 | #189 | Fair 2.1% |
| Spanish Americans | 32.6 /100 | #190 | Fair 2.1% |
| Bermudans | 30.7 /100 | #191 | Fair 2.1% |
| Guamanians/Chamorros | 29.8 /100 | #192 | Fair 2.2% |
| Paraguayans | 29.3 /100 | #193 | Fair 2.2% |
| Immigrants | Albania | 28.3 /100 | #194 | Fair 2.2% |
| Hawaiians | 27.0 /100 | #195 | Fair 2.2% |
| Immigrants | Ukraine | 26.1 /100 | #196 | Fair 2.2% |
| Immigrants | Southern Europe | 23.8 /100 | #197 | Fair 2.2% |
| Immigrants | Chile | 22.7 /100 | #198 | Fair 2.2% |
| Africans | 21.8 /100 | #199 | Fair 2.2% |
Demographics Similar to Immigrants from India by No Schooling Completed
In terms of no schooling completed, the demographic groups most similar to Immigrants from India are Zimbabwean (1.7%, a difference of 0.020%), Cajun (1.7%, a difference of 0.48%), Immigrants from Belgium (1.7%, a difference of 0.60%), Immigrants from England (1.7%, a difference of 0.65%), and Cherokee (1.7%, a difference of 0.65%).
| Demographics | Rating | Rank | No Schooling Completed |
| Canadians | 99.7 /100 | #66 | Exceptional 1.7% |
| Immigrants | Austria | 99.7 /100 | #67 | Exceptional 1.7% |
| Immigrants | Lithuania | 99.7 /100 | #68 | Exceptional 1.7% |
| Chickasaw | 99.6 /100 | #69 | Exceptional 1.7% |
| Immigrants | Netherlands | 99.6 /100 | #70 | Exceptional 1.7% |
| Immigrants | England | 99.5 /100 | #71 | Exceptional 1.7% |
| Cajuns | 99.5 /100 | #72 | Exceptional 1.7% |
| Immigrants | India | 99.4 /100 | #73 | Exceptional 1.7% |
| Zimbabweans | 99.4 /100 | #74 | Exceptional 1.7% |
| Immigrants | Belgium | 99.3 /100 | #75 | Exceptional 1.7% |
| Cherokee | 99.3 /100 | #76 | Exceptional 1.7% |
| Immigrants | Sweden | 99.3 /100 | #77 | Exceptional 1.7% |
| Delaware | 99.3 /100 | #78 | Exceptional 1.7% |
| Macedonians | 99.3 /100 | #79 | Exceptional 1.7% |
| Cypriots | 99.3 /100 | #80 | Exceptional 1.7% |