Greek vs Immigrants from St. Vincent and the Grenadines 11th Grade
COMPARE
Greek
Immigrants from St. Vincent and the Grenadines
11th Grade
11th Grade Comparison
Greeks
Immigrants from St. Vincent and the Grenadines
94.1%
11TH GRADE
99.9/ 100
METRIC RATING
43rd/ 347
METRIC RANK
90.7%
11TH GRADE
0.0/ 100
METRIC RATING
282nd/ 347
METRIC RANK
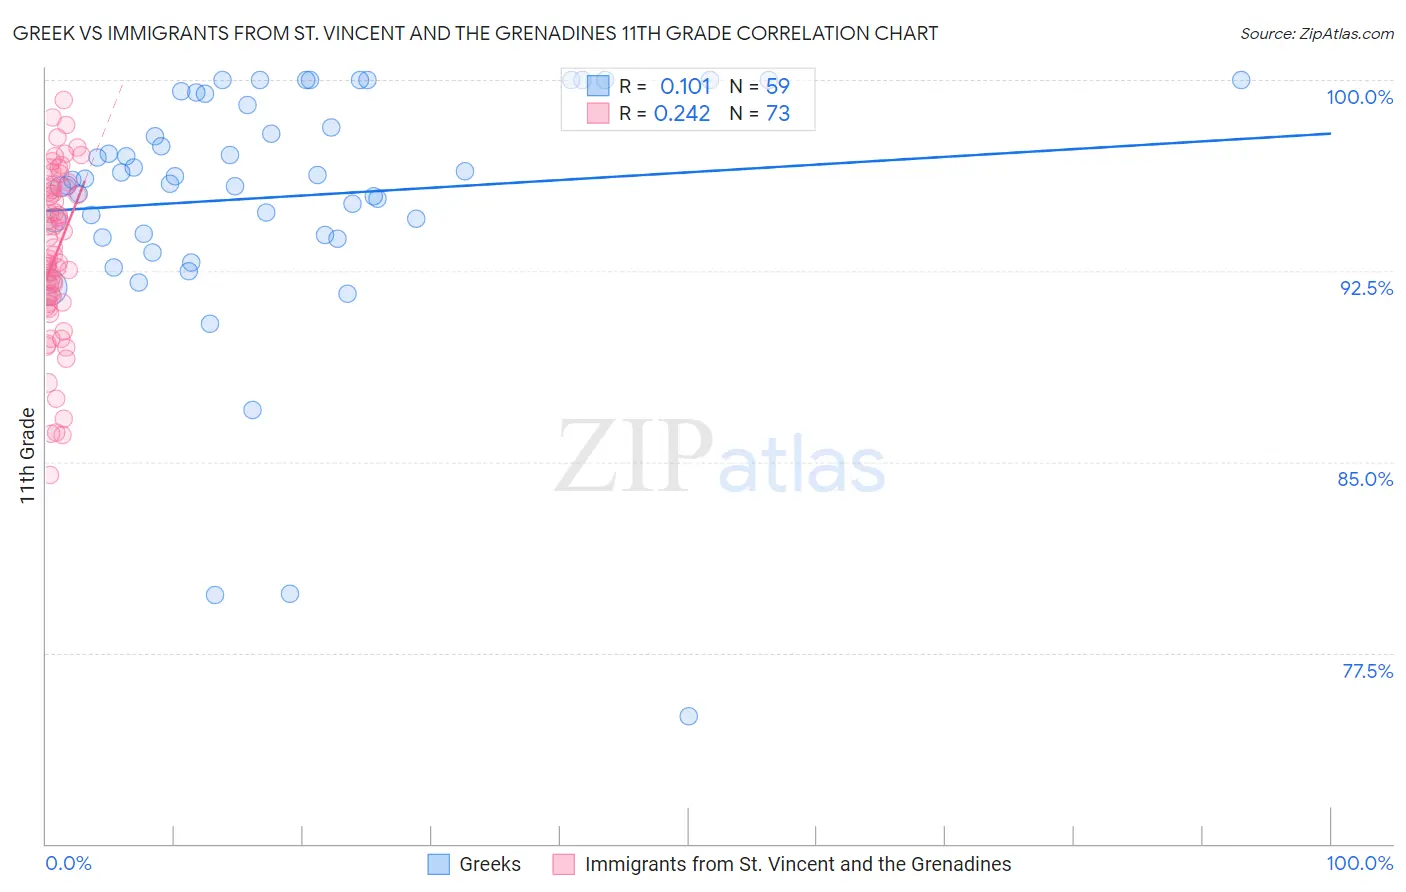
Greek vs Immigrants from St. Vincent and the Grenadines 11th Grade Correlation Chart
The statistical analysis conducted on geographies consisting of 482,775,362 people shows a poor positive correlation between the proportion of Greeks and percentage of population with at least 11th grade education in the United States with a correlation coefficient (R) of 0.101 and weighted average of 94.1%. Similarly, the statistical analysis conducted on geographies consisting of 56,191,418 people shows a weak positive correlation between the proportion of Immigrants from St. Vincent and the Grenadines and percentage of population with at least 11th grade education in the United States with a correlation coefficient (R) of 0.242 and weighted average of 90.7%, a difference of 3.8%.
11th Grade Correlation Summary
| Measurement | Greek | Immigrants from St. Vincent and the Grenadines |
| Minimum | 75.0% | 84.5% |
| Maximum | 100.0% | 99.2% |
| Range | 25.0% | 14.7% |
| Mean | 95.4% | 93.1% |
| Median | 96.1% | 93.0% |
| Interquartile 25% (IQ1) | 93.9% | 91.2% |
| Interquartile 75% (IQ3) | 99.5% | 95.7% |
| Interquartile Range (IQR) | 5.5% | 4.5% |
| Standard Deviation (Sample) | 5.0% | 3.3% |
| Standard Deviation (Population) | 4.9% | 3.3% |
Similar Demographics by 11th Grade
Demographics Similar to Greeks by 11th Grade
In terms of 11th grade, the demographic groups most similar to Greeks are Cypriot (94.1%, a difference of 0.010%), Immigrants from Austria (94.1%, a difference of 0.010%), Immigrants from Ireland (94.1%, a difference of 0.010%), Immigrants from Lithuania (94.1%, a difference of 0.020%), and Thai (94.1%, a difference of 0.020%).
| Demographics | Rating | Rank | 11th Grade |
| Immigrants | Northern Europe | 99.9 /100 | #36 | Exceptional 94.2% |
| Northern Europeans | 99.9 /100 | #37 | Exceptional 94.2% |
| Hungarians | 99.9 /100 | #38 | Exceptional 94.2% |
| Immigrants | Lithuania | 99.9 /100 | #39 | Exceptional 94.1% |
| Thais | 99.9 /100 | #40 | Exceptional 94.1% |
| Cypriots | 99.9 /100 | #41 | Exceptional 94.1% |
| Immigrants | Austria | 99.9 /100 | #42 | Exceptional 94.1% |
| Greeks | 99.9 /100 | #43 | Exceptional 94.1% |
| Immigrants | Ireland | 99.9 /100 | #44 | Exceptional 94.1% |
| Australians | 99.9 /100 | #45 | Exceptional 94.1% |
| Serbians | 99.9 /100 | #46 | Exceptional 94.1% |
| Filipinos | 99.9 /100 | #47 | Exceptional 94.1% |
| Macedonians | 99.9 /100 | #48 | Exceptional 94.1% |
| Slavs | 99.9 /100 | #49 | Exceptional 94.1% |
| French | 99.9 /100 | #50 | Exceptional 94.1% |
Demographics Similar to Immigrants from St. Vincent and the Grenadines by 11th Grade
In terms of 11th grade, the demographic groups most similar to Immigrants from St. Vincent and the Grenadines are Dutch West Indian (90.7%, a difference of 0.010%), Immigrants from Barbados (90.7%, a difference of 0.010%), Sri Lankan (90.7%, a difference of 0.060%), Barbadian (90.8%, a difference of 0.13%), and Malaysian (90.8%, a difference of 0.17%).
| Demographics | Rating | Rank | 11th Grade |
| Immigrants | South Eastern Asia | 0.1 /100 | #275 | Tragic 90.9% |
| Bangladeshis | 0.1 /100 | #276 | Tragic 90.9% |
| Immigrants | Congo | 0.1 /100 | #277 | Tragic 90.9% |
| Malaysians | 0.1 /100 | #278 | Tragic 90.8% |
| Barbadians | 0.0 /100 | #279 | Tragic 90.8% |
| Sri Lankans | 0.0 /100 | #280 | Tragic 90.7% |
| Dutch West Indians | 0.0 /100 | #281 | Tragic 90.7% |
| Immigrants | St. Vincent and the Grenadines | 0.0 /100 | #282 | Tragic 90.7% |
| Immigrants | Barbados | 0.0 /100 | #283 | Tragic 90.7% |
| Immigrants | Laos | 0.0 /100 | #284 | Tragic 90.5% |
| Immigrants | Burma/Myanmar | 0.0 /100 | #285 | Tragic 90.4% |
| Immigrants | West Indies | 0.0 /100 | #286 | Tragic 90.4% |
| Apache | 0.0 /100 | #287 | Tragic 90.4% |
| Pennsylvania Germans | 0.0 /100 | #288 | Tragic 90.3% |
| British West Indians | 0.0 /100 | #289 | Tragic 90.3% |