Greek vs Immigrants from Europe 11th Grade
COMPARE
Greek
Immigrants from Europe
11th Grade
11th Grade Comparison
Greeks
Immigrants from Europe
94.1%
11TH GRADE
99.9/ 100
METRIC RATING
43rd/ 347
METRIC RANK
93.5%
11TH GRADE
98.6/ 100
METRIC RATING
104th/ 347
METRIC RANK
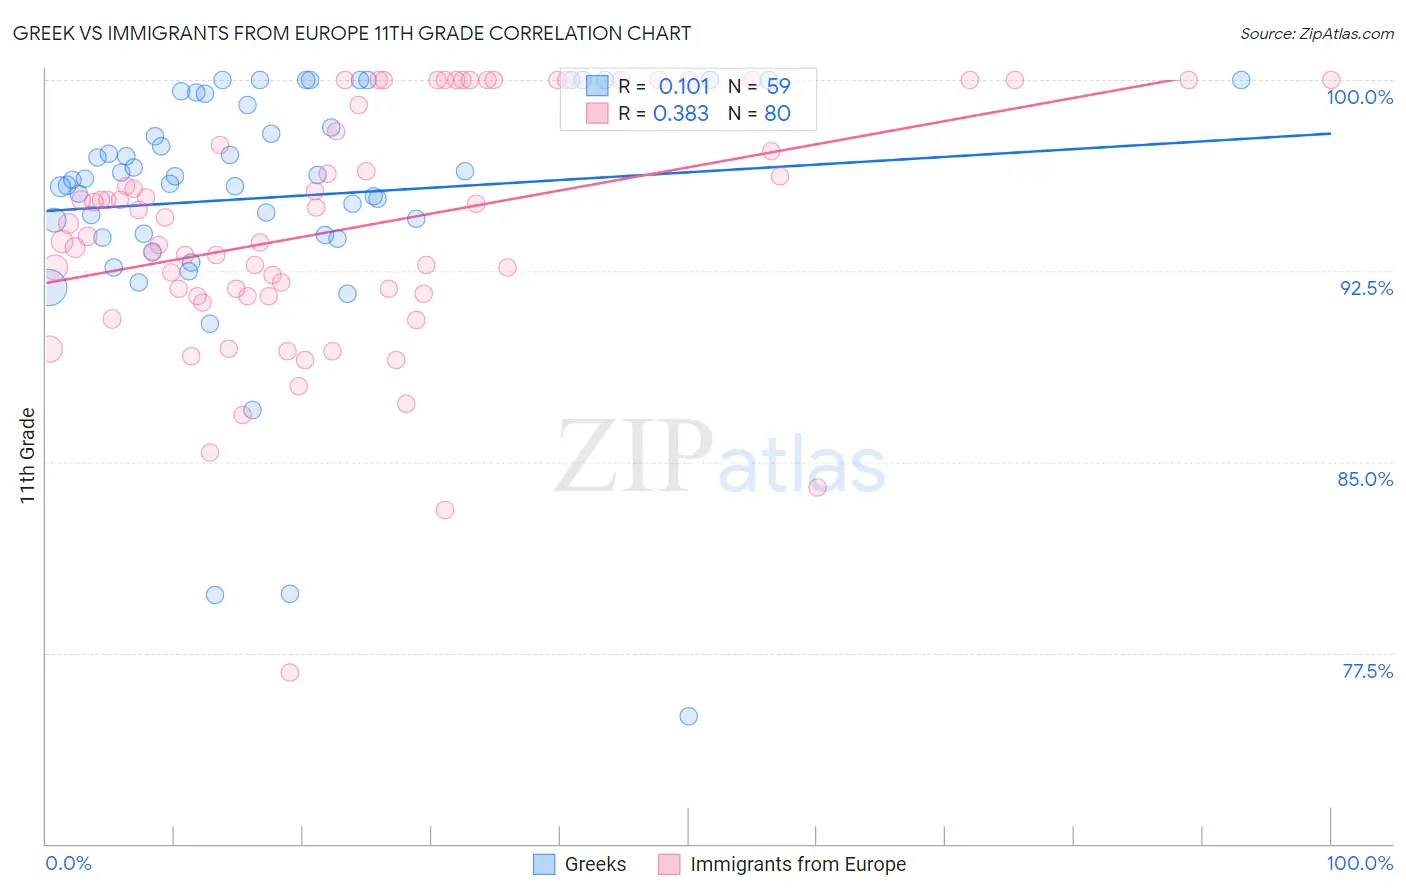
Greek vs Immigrants from Europe 11th Grade Correlation Chart
The statistical analysis conducted on geographies consisting of 482,775,362 people shows a poor positive correlation between the proportion of Greeks and percentage of population with at least 11th grade education in the United States with a correlation coefficient (R) of 0.101 and weighted average of 94.1%. Similarly, the statistical analysis conducted on geographies consisting of 547,425,973 people shows a mild positive correlation between the proportion of Immigrants from Europe and percentage of population with at least 11th grade education in the United States with a correlation coefficient (R) of 0.383 and weighted average of 93.5%, a difference of 0.67%.
11th Grade Correlation Summary
| Measurement | Greek | Immigrants from Europe |
| Minimum | 75.0% | 76.7% |
| Maximum | 100.0% | 100.0% |
| Range | 25.0% | 23.3% |
| Mean | 95.4% | 94.2% |
| Median | 96.1% | 94.5% |
| Interquartile 25% (IQ1) | 93.9% | 91.6% |
| Interquartile 75% (IQ3) | 99.5% | 99.5% |
| Interquartile Range (IQR) | 5.5% | 7.9% |
| Standard Deviation (Sample) | 5.0% | 4.8% |
| Standard Deviation (Population) | 4.9% | 4.7% |
Similar Demographics by 11th Grade
Demographics Similar to Greeks by 11th Grade
In terms of 11th grade, the demographic groups most similar to Greeks are Cypriot (94.1%, a difference of 0.010%), Immigrants from Austria (94.1%, a difference of 0.010%), Immigrants from Ireland (94.1%, a difference of 0.010%), Immigrants from Lithuania (94.1%, a difference of 0.020%), and Thai (94.1%, a difference of 0.020%).
| Demographics | Rating | Rank | 11th Grade |
| Immigrants | Northern Europe | 99.9 /100 | #36 | Exceptional 94.2% |
| Northern Europeans | 99.9 /100 | #37 | Exceptional 94.2% |
| Hungarians | 99.9 /100 | #38 | Exceptional 94.2% |
| Immigrants | Lithuania | 99.9 /100 | #39 | Exceptional 94.1% |
| Thais | 99.9 /100 | #40 | Exceptional 94.1% |
| Cypriots | 99.9 /100 | #41 | Exceptional 94.1% |
| Immigrants | Austria | 99.9 /100 | #42 | Exceptional 94.1% |
| Greeks | 99.9 /100 | #43 | Exceptional 94.1% |
| Immigrants | Ireland | 99.9 /100 | #44 | Exceptional 94.1% |
| Australians | 99.9 /100 | #45 | Exceptional 94.1% |
| Serbians | 99.9 /100 | #46 | Exceptional 94.1% |
| Filipinos | 99.9 /100 | #47 | Exceptional 94.1% |
| Macedonians | 99.9 /100 | #48 | Exceptional 94.1% |
| Slavs | 99.9 /100 | #49 | Exceptional 94.1% |
| French | 99.9 /100 | #50 | Exceptional 94.1% |
Demographics Similar to Immigrants from Europe by 11th Grade
In terms of 11th grade, the demographic groups most similar to Immigrants from Europe are Chippewa (93.5%, a difference of 0.0%), Lebanese (93.5%, a difference of 0.0%), Immigrants from Serbia (93.5%, a difference of 0.0%), Immigrants from Croatia (93.5%, a difference of 0.0%), and Immigrants from Romania (93.5%, a difference of 0.010%).
| Demographics | Rating | Rank | 11th Grade |
| Immigrants | Iran | 98.9 /100 | #97 | Exceptional 93.5% |
| Immigrants | Israel | 98.8 /100 | #98 | Exceptional 93.5% |
| Menominee | 98.7 /100 | #99 | Exceptional 93.5% |
| Immigrants | North Macedonia | 98.7 /100 | #100 | Exceptional 93.5% |
| Immigrants | Romania | 98.7 /100 | #101 | Exceptional 93.5% |
| Chippewa | 98.6 /100 | #102 | Exceptional 93.5% |
| Lebanese | 98.6 /100 | #103 | Exceptional 93.5% |
| Immigrants | Europe | 98.6 /100 | #104 | Exceptional 93.5% |
| Immigrants | Serbia | 98.6 /100 | #105 | Exceptional 93.5% |
| Immigrants | Croatia | 98.6 /100 | #106 | Exceptional 93.5% |
| Immigrants | Norway | 98.4 /100 | #107 | Exceptional 93.5% |
| Alaska Natives | 98.4 /100 | #108 | Exceptional 93.5% |
| Immigrants | Kuwait | 98.4 /100 | #109 | Exceptional 93.5% |
| Syrians | 98.4 /100 | #110 | Exceptional 93.4% |
| Yugoslavians | 98.1 /100 | #111 | Exceptional 93.4% |