Greek vs Puget Sound Salish 1st Grade
COMPARE
Greek
Puget Sound Salish
1st Grade
1st Grade Comparison
Greeks
Puget Sound Salish
98.4%
1ST GRADE
99.7/ 100
METRIC RATING
64th/ 347
METRIC RANK
98.2%
1ST GRADE
98.2/ 100
METRIC RATING
99th/ 347
METRIC RANK
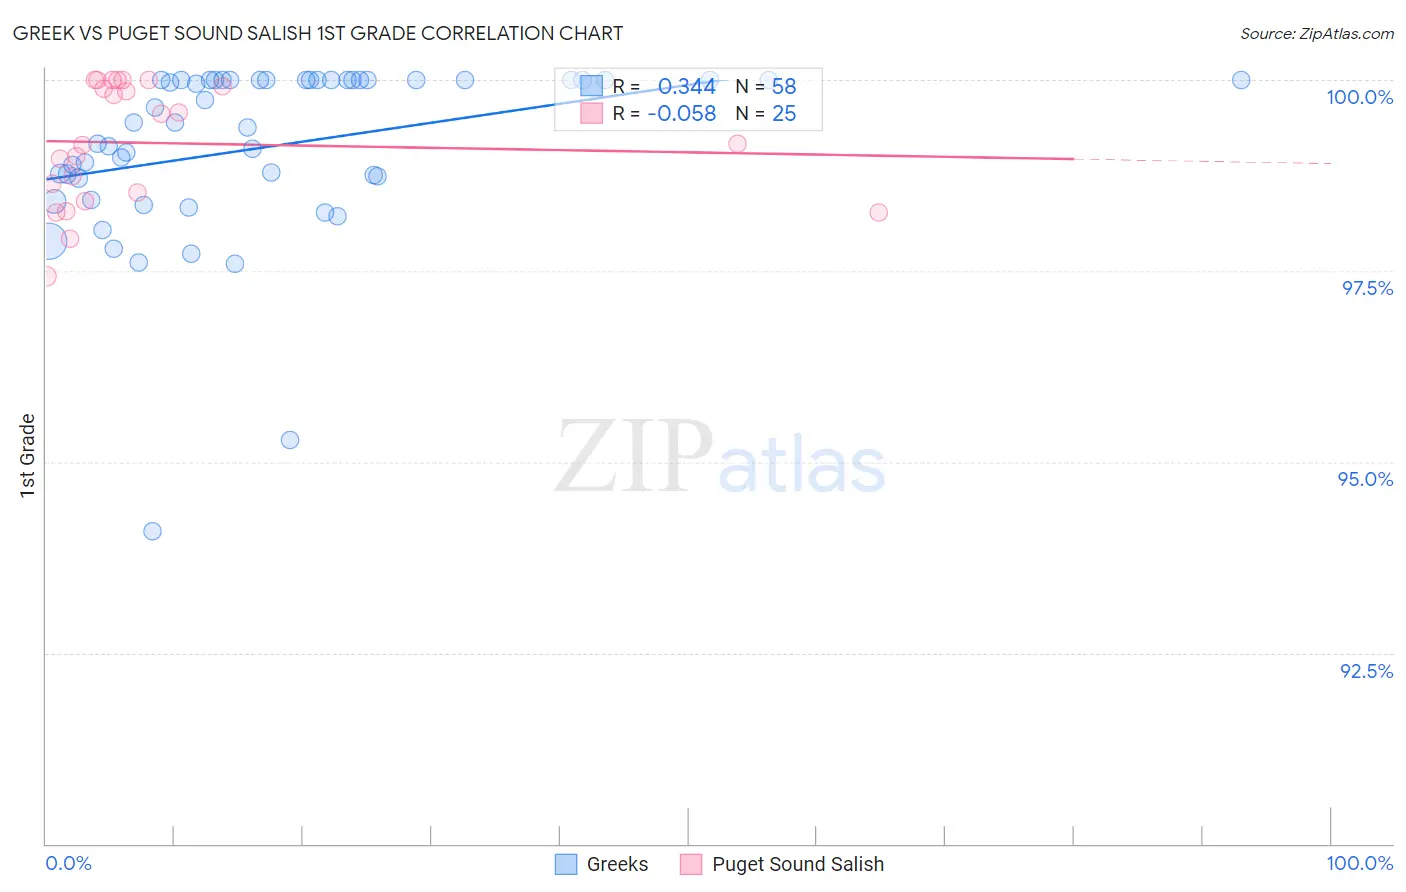
Greek vs Puget Sound Salish 1st Grade Correlation Chart
The statistical analysis conducted on geographies consisting of 482,775,358 people shows a mild positive correlation between the proportion of Greeks and percentage of population with at least 1st grade education in the United States with a correlation coefficient (R) of 0.344 and weighted average of 98.4%. Similarly, the statistical analysis conducted on geographies consisting of 46,155,746 people shows a slight negative correlation between the proportion of Puget Sound Salish and percentage of population with at least 1st grade education in the United States with a correlation coefficient (R) of -0.058 and weighted average of 98.2%, a difference of 0.14%.
1st Grade Correlation Summary
| Measurement | Greek | Puget Sound Salish |
| Minimum | 94.1% | 97.4% |
| Maximum | 100.0% | 100.0% |
| Range | 5.9% | 2.6% |
| Mean | 99.1% | 99.2% |
| Median | 99.4% | 99.2% |
| Interquartile 25% (IQ1) | 98.7% | 98.5% |
| Interquartile 75% (IQ3) | 100.0% | 100.0% |
| Interquartile Range (IQR) | 1.3% | 1.5% |
| Standard Deviation (Sample) | 1.2% | 0.79% |
| Standard Deviation (Population) | 1.1% | 0.77% |
Similar Demographics by 1st Grade
Demographics Similar to Greeks by 1st Grade
In terms of 1st grade, the demographic groups most similar to Greeks are Bulgarian (98.4%, a difference of 0.0%), Slavic (98.4%, a difference of 0.0%), Immigrants from North America (98.4%, a difference of 0.0%), Austrian (98.4%, a difference of 0.010%), and New Zealander (98.4%, a difference of 0.010%).
| Demographics | Rating | Rank | 1st Grade |
| Austrians | 99.8 /100 | #57 | Exceptional 98.4% |
| New Zealanders | 99.7 /100 | #58 | Exceptional 98.4% |
| Creek | 99.7 /100 | #59 | Exceptional 98.4% |
| Immigrants | Canada | 99.7 /100 | #60 | Exceptional 98.4% |
| Bulgarians | 99.7 /100 | #61 | Exceptional 98.4% |
| Slavs | 99.7 /100 | #62 | Exceptional 98.4% |
| Immigrants | North America | 99.7 /100 | #63 | Exceptional 98.4% |
| Greeks | 99.7 /100 | #64 | Exceptional 98.4% |
| Maltese | 99.7 /100 | #65 | Exceptional 98.4% |
| Canadians | 99.6 /100 | #66 | Exceptional 98.3% |
| Immigrants | Austria | 99.6 /100 | #67 | Exceptional 98.3% |
| Immigrants | Northern Europe | 99.6 /100 | #68 | Exceptional 98.3% |
| Chickasaw | 99.6 /100 | #69 | Exceptional 98.3% |
| Russians | 99.6 /100 | #70 | Exceptional 98.3% |
| Serbians | 99.6 /100 | #71 | Exceptional 98.3% |
Demographics Similar to Puget Sound Salish by 1st Grade
In terms of 1st grade, the demographic groups most similar to Puget Sound Salish are Cypriot (98.2%, a difference of 0.0%), Nonimmigrants (98.2%, a difference of 0.0%), Choctaw (98.2%, a difference of 0.0%), Immigrants from Germany (98.2%, a difference of 0.010%), and Colville (98.2%, a difference of 0.010%).
| Demographics | Rating | Rank | 1st Grade |
| Macedonians | 98.7 /100 | #92 | Exceptional 98.3% |
| Immigrants | India | 98.6 /100 | #93 | Exceptional 98.2% |
| South Africans | 98.6 /100 | #94 | Exceptional 98.2% |
| Immigrants | Germany | 98.5 /100 | #95 | Exceptional 98.2% |
| Cypriots | 98.3 /100 | #96 | Exceptional 98.2% |
| Immigrants | Nonimmigrants | 98.3 /100 | #97 | Exceptional 98.2% |
| Choctaw | 98.3 /100 | #98 | Exceptional 98.2% |
| Puget Sound Salish | 98.2 /100 | #99 | Exceptional 98.2% |
| Colville | 98.0 /100 | #100 | Exceptional 98.2% |
| Romanians | 97.8 /100 | #101 | Exceptional 98.2% |
| Cree | 97.8 /100 | #102 | Exceptional 98.2% |
| Immigrants | Ireland | 97.7 /100 | #103 | Exceptional 98.2% |
| Pima | 97.5 /100 | #104 | Exceptional 98.2% |
| Basques | 97.4 /100 | #105 | Exceptional 98.2% |
| Turks | 97.4 /100 | #106 | Exceptional 98.2% |