Arab vs Puget Sound Salish 1st Grade
COMPARE
Arab
Puget Sound Salish
1st Grade
1st Grade Comparison
Arabs
Puget Sound Salish
97.9%
1ST GRADE
35.5/ 100
METRIC RATING
188th/ 347
METRIC RANK
98.2%
1ST GRADE
98.2/ 100
METRIC RATING
99th/ 347
METRIC RANK
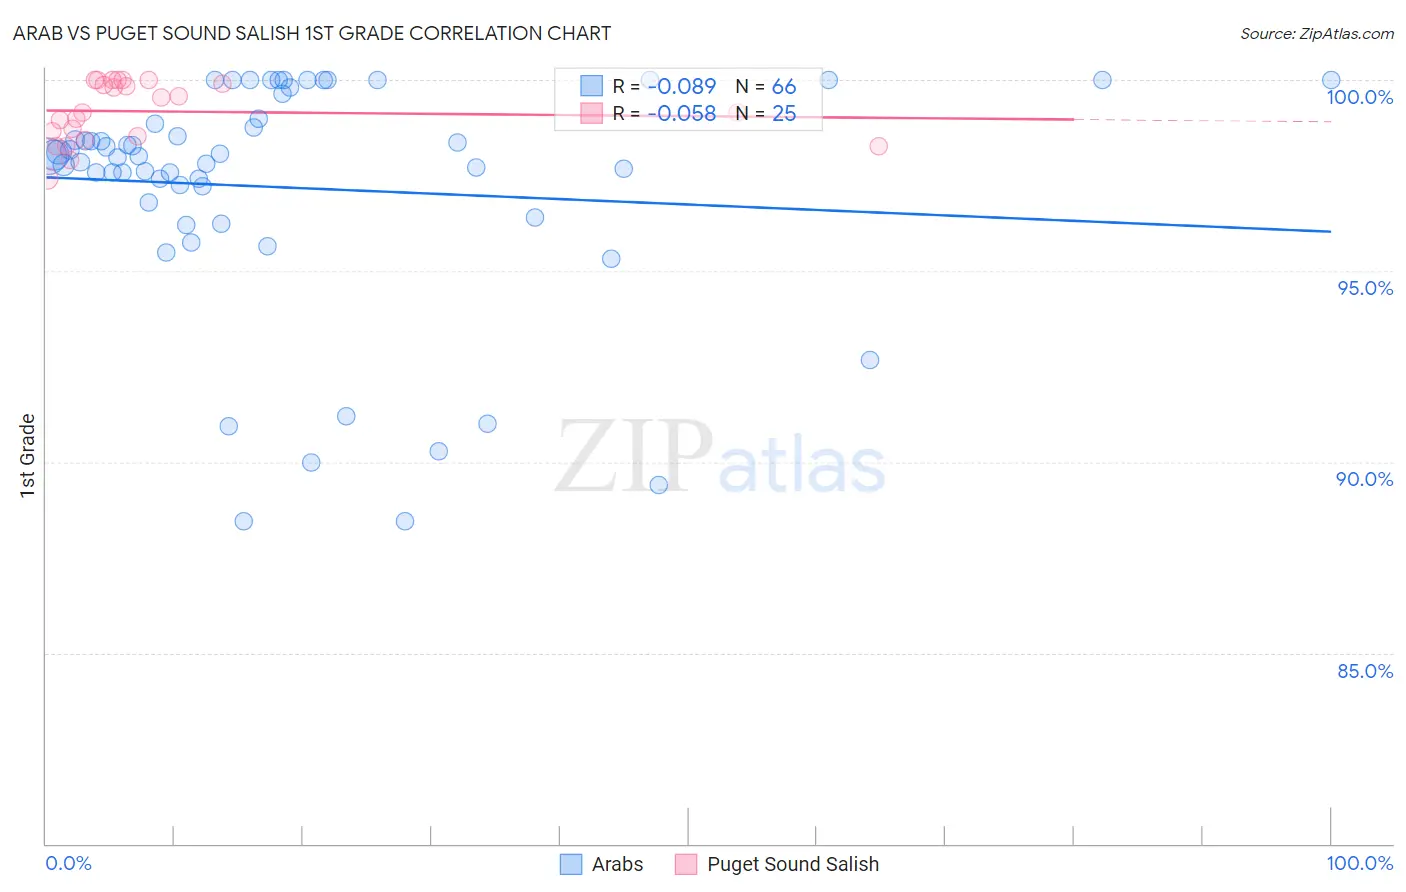
Arab vs Puget Sound Salish 1st Grade Correlation Chart
The statistical analysis conducted on geographies consisting of 486,872,222 people shows a slight negative correlation between the proportion of Arabs and percentage of population with at least 1st grade education in the United States with a correlation coefficient (R) of -0.089 and weighted average of 97.9%. Similarly, the statistical analysis conducted on geographies consisting of 46,155,746 people shows a slight negative correlation between the proportion of Puget Sound Salish and percentage of population with at least 1st grade education in the United States with a correlation coefficient (R) of -0.058 and weighted average of 98.2%, a difference of 0.36%.
1st Grade Correlation Summary
| Measurement | Arab | Puget Sound Salish |
| Minimum | 88.4% | 97.4% |
| Maximum | 100.0% | 100.0% |
| Range | 11.6% | 2.6% |
| Mean | 97.2% | 99.2% |
| Median | 98.0% | 99.2% |
| Interquartile 25% (IQ1) | 96.8% | 98.5% |
| Interquartile 75% (IQ3) | 99.0% | 100.0% |
| Interquartile Range (IQR) | 2.2% | 1.5% |
| Standard Deviation (Sample) | 3.1% | 0.79% |
| Standard Deviation (Population) | 3.0% | 0.77% |
Similar Demographics by 1st Grade
Demographics Similar to Arabs by 1st Grade
In terms of 1st grade, the demographic groups most similar to Arabs are Paiute (97.9%, a difference of 0.0%), Pakistani (97.9%, a difference of 0.0%), Immigrants from Kazakhstan (97.9%, a difference of 0.0%), Panamanian (97.9%, a difference of 0.0%), and Immigrants from Belarus (97.9%, a difference of 0.010%).
| Demographics | Rating | Rank | 1st Grade |
| Portuguese | 44.2 /100 | #181 | Average 97.9% |
| Egyptians | 42.7 /100 | #182 | Average 97.9% |
| Immigrants | Argentina | 41.3 /100 | #183 | Average 97.9% |
| Immigrants | Poland | 40.1 /100 | #184 | Average 97.9% |
| Immigrants | Belarus | 39.3 /100 | #185 | Fair 97.9% |
| Paiute | 36.5 /100 | #186 | Fair 97.9% |
| Pakistanis | 35.8 /100 | #187 | Fair 97.9% |
| Arabs | 35.5 /100 | #188 | Fair 97.9% |
| Immigrants | Kazakhstan | 34.9 /100 | #189 | Fair 97.9% |
| Panamanians | 34.1 /100 | #190 | Fair 97.9% |
| Blacks/African Americans | 30.7 /100 | #191 | Fair 97.9% |
| Paraguayans | 30.2 /100 | #192 | Fair 97.9% |
| Immigrants | Taiwan | 29.4 /100 | #193 | Fair 97.9% |
| Mongolians | 29.2 /100 | #194 | Fair 97.9% |
| Hawaiians | 28.8 /100 | #195 | Fair 97.9% |
Demographics Similar to Puget Sound Salish by 1st Grade
In terms of 1st grade, the demographic groups most similar to Puget Sound Salish are Cypriot (98.2%, a difference of 0.0%), Nonimmigrants (98.2%, a difference of 0.0%), Choctaw (98.2%, a difference of 0.0%), Immigrants from Germany (98.2%, a difference of 0.010%), and Colville (98.2%, a difference of 0.010%).
| Demographics | Rating | Rank | 1st Grade |
| Macedonians | 98.7 /100 | #92 | Exceptional 98.3% |
| Immigrants | India | 98.6 /100 | #93 | Exceptional 98.2% |
| South Africans | 98.6 /100 | #94 | Exceptional 98.2% |
| Immigrants | Germany | 98.5 /100 | #95 | Exceptional 98.2% |
| Cypriots | 98.3 /100 | #96 | Exceptional 98.2% |
| Immigrants | Nonimmigrants | 98.3 /100 | #97 | Exceptional 98.2% |
| Choctaw | 98.3 /100 | #98 | Exceptional 98.2% |
| Puget Sound Salish | 98.2 /100 | #99 | Exceptional 98.2% |
| Colville | 98.0 /100 | #100 | Exceptional 98.2% |
| Romanians | 97.8 /100 | #101 | Exceptional 98.2% |
| Cree | 97.8 /100 | #102 | Exceptional 98.2% |
| Immigrants | Ireland | 97.7 /100 | #103 | Exceptional 98.2% |
| Pima | 97.5 /100 | #104 | Exceptional 98.2% |
| Basques | 97.4 /100 | #105 | Exceptional 98.2% |
| Turks | 97.4 /100 | #106 | Exceptional 98.2% |