Immigrants from Central America vs Puget Sound Salish 1st Grade
COMPARE
Immigrants from Central America
Puget Sound Salish
1st Grade
1st Grade Comparison
Immigrants from Central America
Puget Sound Salish
96.3%
1ST GRADE
0.0/ 100
METRIC RATING
341st/ 347
METRIC RANK
98.2%
1ST GRADE
98.2/ 100
METRIC RATING
99th/ 347
METRIC RANK
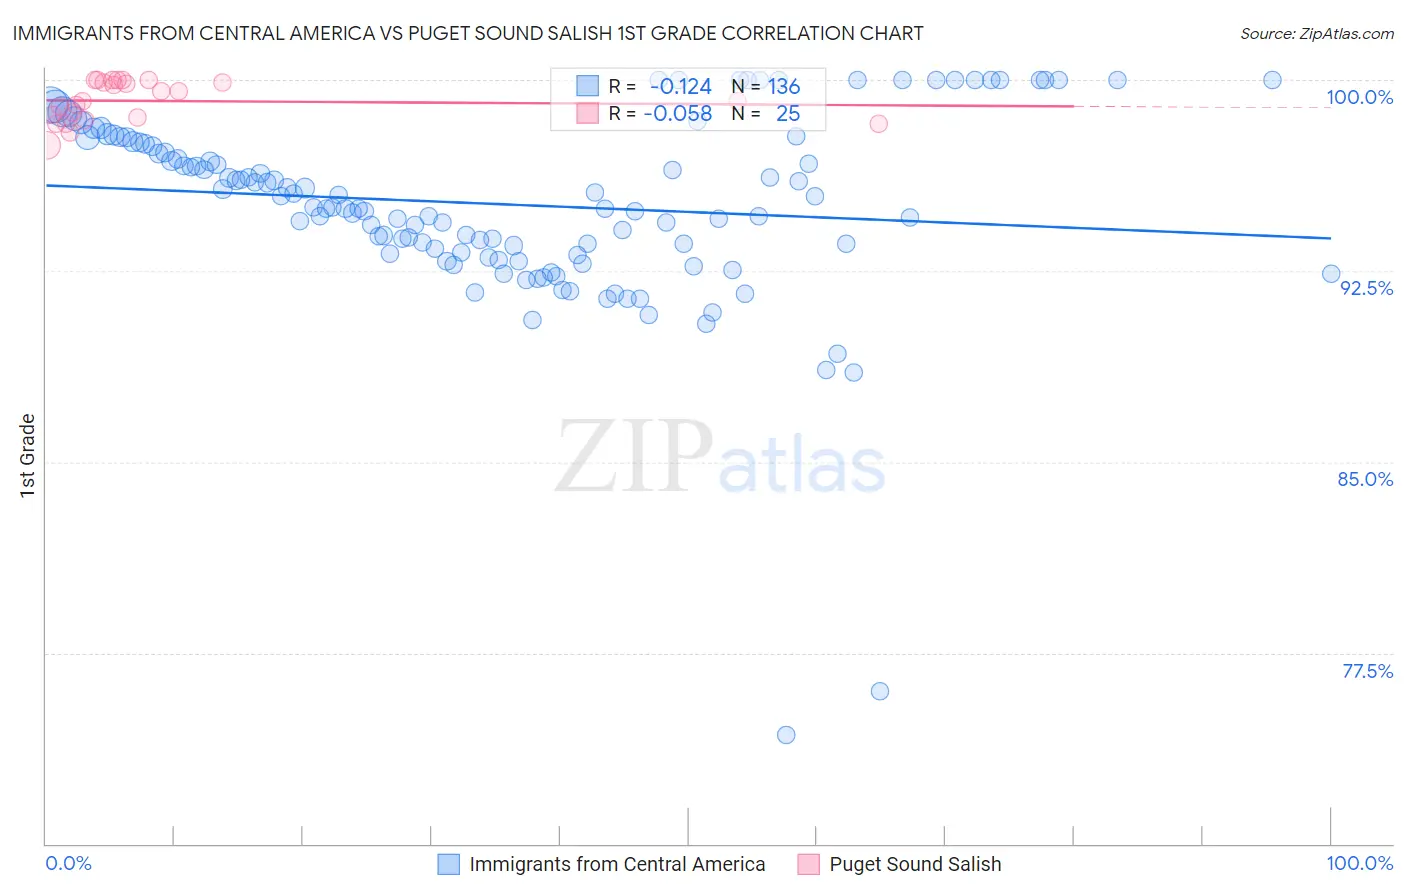
Immigrants from Central America vs Puget Sound Salish 1st Grade Correlation Chart
The statistical analysis conducted on geographies consisting of 536,554,221 people shows a poor negative correlation between the proportion of Immigrants from Central America and percentage of population with at least 1st grade education in the United States with a correlation coefficient (R) of -0.124 and weighted average of 96.3%. Similarly, the statistical analysis conducted on geographies consisting of 46,155,746 people shows a slight negative correlation between the proportion of Puget Sound Salish and percentage of population with at least 1st grade education in the United States with a correlation coefficient (R) of -0.058 and weighted average of 98.2%, a difference of 2.0%.
1st Grade Correlation Summary
| Measurement | Immigrants from Central America | Puget Sound Salish |
| Minimum | 74.3% | 97.4% |
| Maximum | 100.0% | 100.0% |
| Range | 25.7% | 2.6% |
| Mean | 95.1% | 99.2% |
| Median | 95.0% | 99.2% |
| Interquartile 25% (IQ1) | 93.2% | 98.5% |
| Interquartile 75% (IQ3) | 97.6% | 100.0% |
| Interquartile Range (IQR) | 4.4% | 1.5% |
| Standard Deviation (Sample) | 3.7% | 0.79% |
| Standard Deviation (Population) | 3.7% | 0.77% |
Similar Demographics by 1st Grade
Demographics Similar to Immigrants from Central America by 1st Grade
In terms of 1st grade, the demographic groups most similar to Immigrants from Central America are Immigrants from Cabo Verde (96.3%, a difference of 0.020%), Immigrants from Mexico (96.3%, a difference of 0.030%), Immigrants from Guatemala (96.4%, a difference of 0.040%), Salvadoran (96.3%, a difference of 0.060%), and Immigrants from Fiji (96.4%, a difference of 0.11%).
| Demographics | Rating | Rank | 1st Grade |
| Immigrants | Dominican Republic | 0.0 /100 | #333 | Tragic 96.5% |
| Bangladeshis | 0.0 /100 | #334 | Tragic 96.5% |
| Yakama | 0.0 /100 | #335 | Tragic 96.5% |
| Guatemalans | 0.0 /100 | #336 | Tragic 96.5% |
| Immigrants | Cambodia | 0.0 /100 | #337 | Tragic 96.5% |
| Immigrants | Fiji | 0.0 /100 | #338 | Tragic 96.4% |
| Immigrants | Guatemala | 0.0 /100 | #339 | Tragic 96.4% |
| Immigrants | Cabo Verde | 0.0 /100 | #340 | Tragic 96.3% |
| Immigrants | Central America | 0.0 /100 | #341 | Tragic 96.3% |
| Immigrants | Mexico | 0.0 /100 | #342 | Tragic 96.3% |
| Salvadorans | 0.0 /100 | #343 | Tragic 96.3% |
| Nepalese | 0.0 /100 | #344 | Tragic 96.1% |
| Immigrants | El Salvador | 0.0 /100 | #345 | Tragic 96.1% |
| Immigrants | Yemen | 0.0 /100 | #346 | Tragic 95.8% |
| Spanish American Indians | 0.0 /100 | #347 | Tragic 95.7% |
Demographics Similar to Puget Sound Salish by 1st Grade
In terms of 1st grade, the demographic groups most similar to Puget Sound Salish are Cypriot (98.2%, a difference of 0.0%), Nonimmigrants (98.2%, a difference of 0.0%), Choctaw (98.2%, a difference of 0.0%), Immigrants from Germany (98.2%, a difference of 0.010%), and Colville (98.2%, a difference of 0.010%).
| Demographics | Rating | Rank | 1st Grade |
| Macedonians | 98.7 /100 | #92 | Exceptional 98.3% |
| Immigrants | India | 98.6 /100 | #93 | Exceptional 98.2% |
| South Africans | 98.6 /100 | #94 | Exceptional 98.2% |
| Immigrants | Germany | 98.5 /100 | #95 | Exceptional 98.2% |
| Cypriots | 98.3 /100 | #96 | Exceptional 98.2% |
| Immigrants | Nonimmigrants | 98.3 /100 | #97 | Exceptional 98.2% |
| Choctaw | 98.3 /100 | #98 | Exceptional 98.2% |
| Puget Sound Salish | 98.2 /100 | #99 | Exceptional 98.2% |
| Colville | 98.0 /100 | #100 | Exceptional 98.2% |
| Romanians | 97.8 /100 | #101 | Exceptional 98.2% |
| Cree | 97.8 /100 | #102 | Exceptional 98.2% |
| Immigrants | Ireland | 97.7 /100 | #103 | Exceptional 98.2% |
| Pima | 97.5 /100 | #104 | Exceptional 98.2% |
| Basques | 97.4 /100 | #105 | Exceptional 98.2% |
| Turks | 97.4 /100 | #106 | Exceptional 98.2% |