Greek vs West Indian 1st Grade
COMPARE
Greek
West Indian
1st Grade
1st Grade Comparison
Greeks
West Indians
98.4%
1ST GRADE
99.7/ 100
METRIC RATING
64th/ 347
METRIC RANK
97.5%
1ST GRADE
0.3/ 100
METRIC RATING
269th/ 347
METRIC RANK
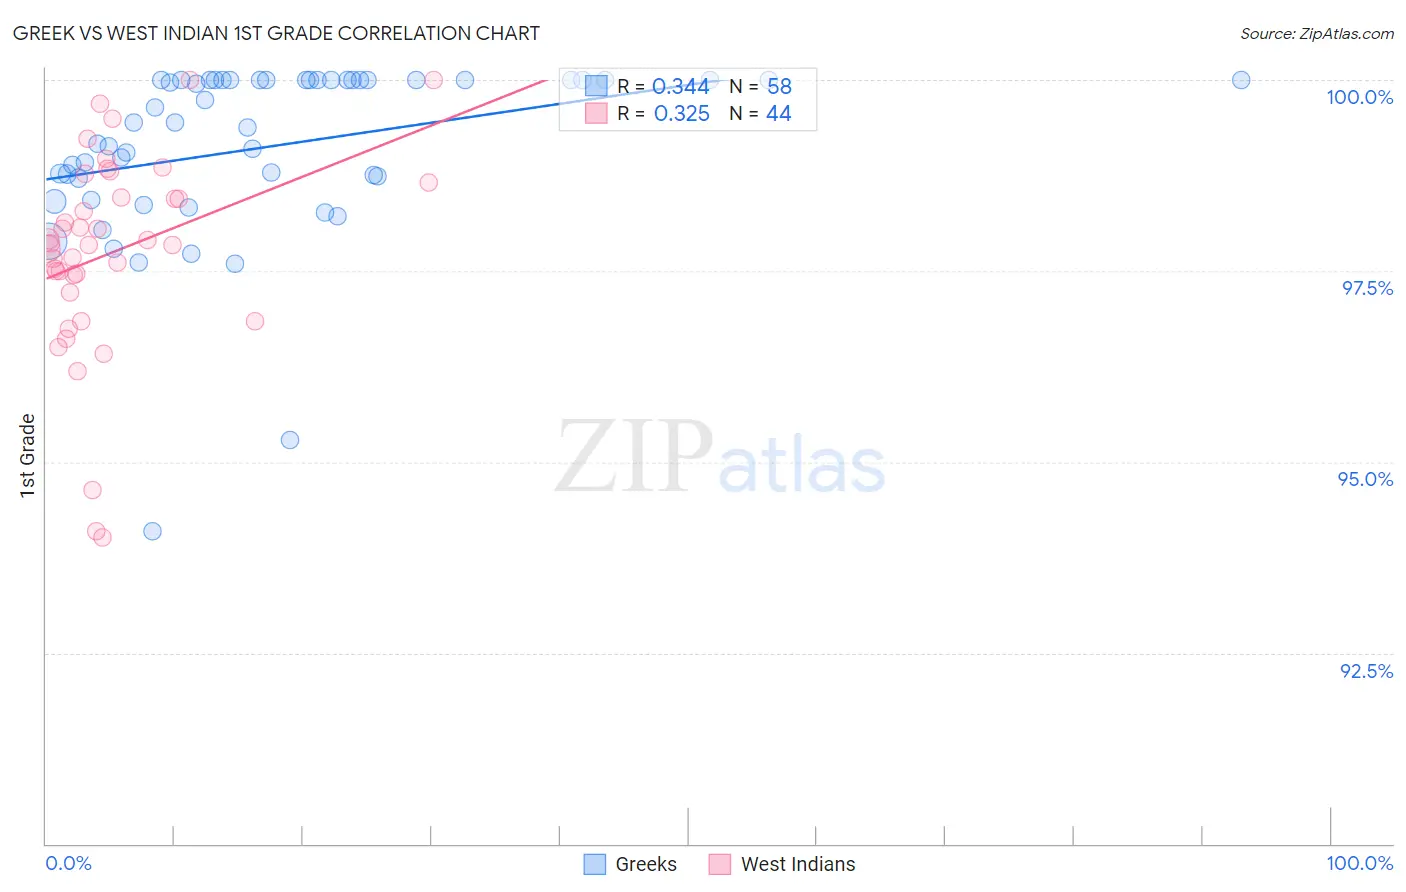
Greek vs West Indian 1st Grade Correlation Chart
The statistical analysis conducted on geographies consisting of 482,775,358 people shows a mild positive correlation between the proportion of Greeks and percentage of population with at least 1st grade education in the United States with a correlation coefficient (R) of 0.344 and weighted average of 98.4%. Similarly, the statistical analysis conducted on geographies consisting of 254,063,654 people shows a mild positive correlation between the proportion of West Indians and percentage of population with at least 1st grade education in the United States with a correlation coefficient (R) of 0.325 and weighted average of 97.5%, a difference of 0.92%.
1st Grade Correlation Summary
| Measurement | Greek | West Indian |
| Minimum | 94.1% | 94.0% |
| Maximum | 100.0% | 100.0% |
| Range | 5.9% | 6.0% |
| Mean | 99.1% | 97.7% |
| Median | 99.4% | 97.9% |
| Interquartile 25% (IQ1) | 98.7% | 97.3% |
| Interquartile 75% (IQ3) | 100.0% | 98.6% |
| Interquartile Range (IQR) | 1.3% | 1.2% |
| Standard Deviation (Sample) | 1.2% | 1.3% |
| Standard Deviation (Population) | 1.1% | 1.3% |
Similar Demographics by 1st Grade
Demographics Similar to Greeks by 1st Grade
In terms of 1st grade, the demographic groups most similar to Greeks are Bulgarian (98.4%, a difference of 0.0%), Slavic (98.4%, a difference of 0.0%), Immigrants from North America (98.4%, a difference of 0.0%), Austrian (98.4%, a difference of 0.010%), and New Zealander (98.4%, a difference of 0.010%).
| Demographics | Rating | Rank | 1st Grade |
| Austrians | 99.8 /100 | #57 | Exceptional 98.4% |
| New Zealanders | 99.7 /100 | #58 | Exceptional 98.4% |
| Creek | 99.7 /100 | #59 | Exceptional 98.4% |
| Immigrants | Canada | 99.7 /100 | #60 | Exceptional 98.4% |
| Bulgarians | 99.7 /100 | #61 | Exceptional 98.4% |
| Slavs | 99.7 /100 | #62 | Exceptional 98.4% |
| Immigrants | North America | 99.7 /100 | #63 | Exceptional 98.4% |
| Greeks | 99.7 /100 | #64 | Exceptional 98.4% |
| Maltese | 99.7 /100 | #65 | Exceptional 98.4% |
| Canadians | 99.6 /100 | #66 | Exceptional 98.3% |
| Immigrants | Austria | 99.6 /100 | #67 | Exceptional 98.3% |
| Immigrants | Northern Europe | 99.6 /100 | #68 | Exceptional 98.3% |
| Chickasaw | 99.6 /100 | #69 | Exceptional 98.3% |
| Russians | 99.6 /100 | #70 | Exceptional 98.3% |
| Serbians | 99.6 /100 | #71 | Exceptional 98.3% |
Demographics Similar to West Indians by 1st Grade
In terms of 1st grade, the demographic groups most similar to West Indians are Immigrants from Sierra Leone (97.5%, a difference of 0.010%), Immigrants from Nigeria (97.5%, a difference of 0.010%), Cuban (97.5%, a difference of 0.020%), Immigrants from Liberia (97.5%, a difference of 0.020%), and Immigrants from Jamaica (97.5%, a difference of 0.020%).
| Demographics | Rating | Rank | 1st Grade |
| Assyrians/Chaldeans/Syriacs | 0.4 /100 | #262 | Tragic 97.5% |
| Immigrants | South America | 0.4 /100 | #263 | Tragic 97.5% |
| Taiwanese | 0.4 /100 | #264 | Tragic 97.5% |
| Cubans | 0.3 /100 | #265 | Tragic 97.5% |
| Immigrants | Liberia | 0.3 /100 | #266 | Tragic 97.5% |
| Immigrants | Sierra Leone | 0.3 /100 | #267 | Tragic 97.5% |
| Immigrants | Nigeria | 0.3 /100 | #268 | Tragic 97.5% |
| West Indians | 0.3 /100 | #269 | Tragic 97.5% |
| Immigrants | Jamaica | 0.2 /100 | #270 | Tragic 97.5% |
| Immigrants | Cameroon | 0.2 /100 | #271 | Tragic 97.4% |
| Immigrants | Peru | 0.2 /100 | #272 | Tragic 97.4% |
| Immigrants | Bolivia | 0.2 /100 | #273 | Tragic 97.4% |
| Ghanaians | 0.1 /100 | #274 | Tragic 97.4% |
| Immigrants | China | 0.1 /100 | #275 | Tragic 97.4% |
| Immigrants | Philippines | 0.1 /100 | #276 | Tragic 97.4% |