Greek vs Puget Sound Salish 9th Grade
COMPARE
Greek
Puget Sound Salish
9th Grade
9th Grade Comparison
Greeks
Puget Sound Salish
96.0%
9TH GRADE
99.9/ 100
METRIC RATING
49th/ 347
METRIC RANK
95.7%
9TH GRADE
99.2/ 100
METRIC RATING
82nd/ 347
METRIC RANK
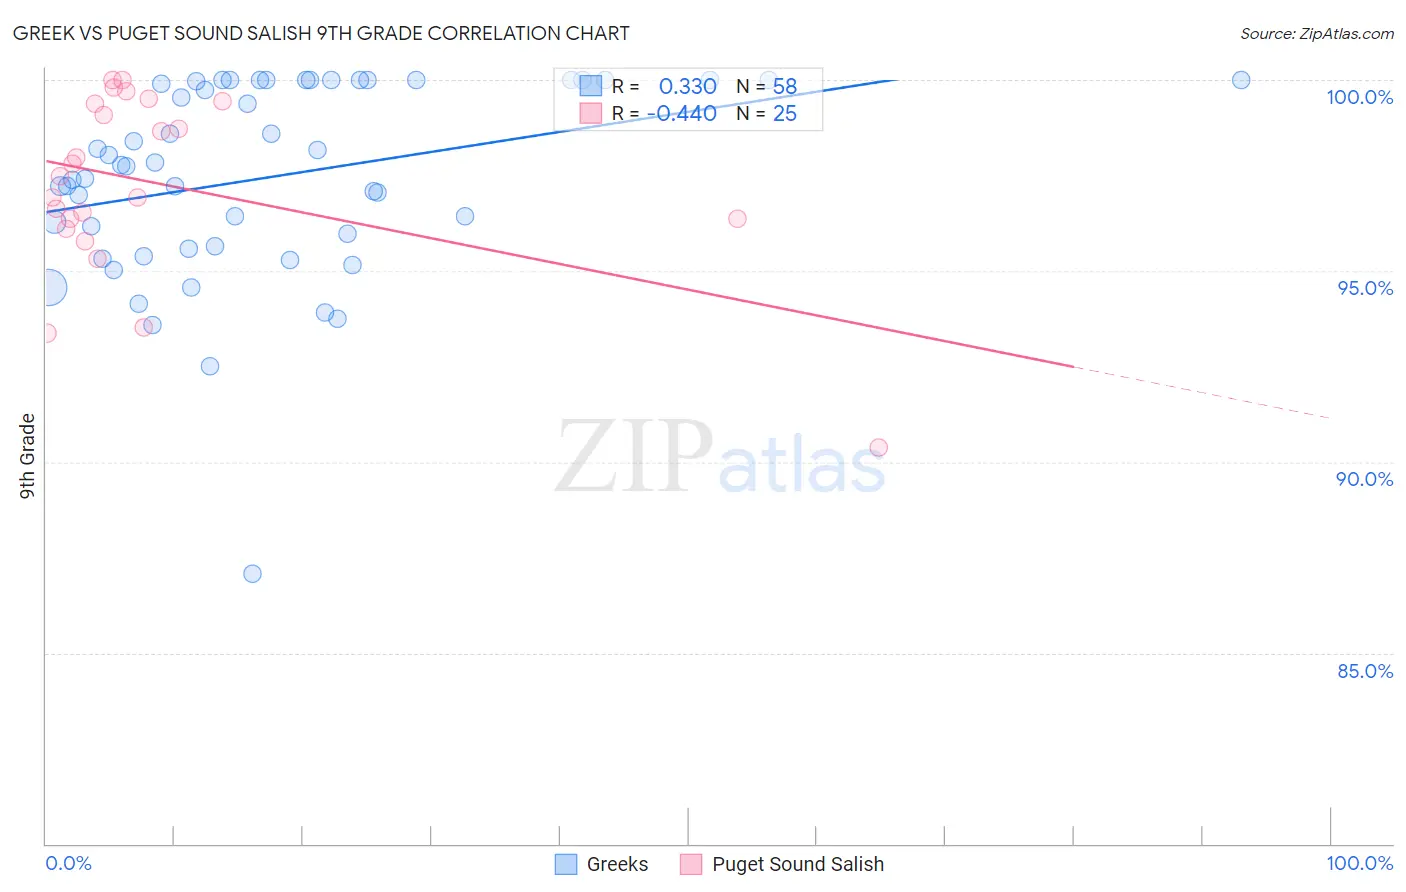
Greek vs Puget Sound Salish 9th Grade Correlation Chart
The statistical analysis conducted on geographies consisting of 482,775,358 people shows a mild positive correlation between the proportion of Greeks and percentage of population with at least 9th grade education in the United States with a correlation coefficient (R) of 0.330 and weighted average of 96.0%. Similarly, the statistical analysis conducted on geographies consisting of 46,155,775 people shows a moderate negative correlation between the proportion of Puget Sound Salish and percentage of population with at least 9th grade education in the United States with a correlation coefficient (R) of -0.440 and weighted average of 95.7%, a difference of 0.33%.
9th Grade Correlation Summary
| Measurement | Greek | Puget Sound Salish |
| Minimum | 87.1% | 90.4% |
| Maximum | 100.0% | 100.0% |
| Range | 12.9% | 9.6% |
| Mean | 97.5% | 97.3% |
| Median | 97.7% | 97.5% |
| Interquartile 25% (IQ1) | 95.6% | 96.2% |
| Interquartile 75% (IQ3) | 100.0% | 99.4% |
| Interquartile Range (IQR) | 4.4% | 3.2% |
| Standard Deviation (Sample) | 2.6% | 2.4% |
| Standard Deviation (Population) | 2.5% | 2.3% |
Similar Demographics by 9th Grade
Demographics Similar to Greeks by 9th Grade
In terms of 9th grade, the demographic groups most similar to Greeks are Russian (96.0%, a difference of 0.010%), Australian (96.0%, a difference of 0.010%), Celtic (96.0%, a difference of 0.010%), Crow (96.1%, a difference of 0.020%), and Immigrants from India (96.1%, a difference of 0.020%).
| Demographics | Rating | Rank | 9th Grade |
| Chippewa | 99.9 /100 | #42 | Exceptional 96.1% |
| Iranians | 99.9 /100 | #43 | Exceptional 96.1% |
| Alaska Natives | 99.9 /100 | #44 | Exceptional 96.1% |
| Crow | 99.9 /100 | #45 | Exceptional 96.1% |
| Immigrants | India | 99.9 /100 | #46 | Exceptional 96.1% |
| Russians | 99.9 /100 | #47 | Exceptional 96.0% |
| Australians | 99.9 /100 | #48 | Exceptional 96.0% |
| Greeks | 99.9 /100 | #49 | Exceptional 96.0% |
| Celtics | 99.9 /100 | #50 | Exceptional 96.0% |
| Immigrants | Northern Europe | 99.9 /100 | #51 | Exceptional 96.0% |
| Serbians | 99.9 /100 | #52 | Exceptional 96.0% |
| Austrians | 99.8 /100 | #53 | Exceptional 96.0% |
| Immigrants | Canada | 99.8 /100 | #54 | Exceptional 96.0% |
| Immigrants | Austria | 99.8 /100 | #55 | Exceptional 96.0% |
| Immigrants | North America | 99.8 /100 | #56 | Exceptional 96.0% |
Demographics Similar to Puget Sound Salish by 9th Grade
In terms of 9th grade, the demographic groups most similar to Puget Sound Salish are Bhutanese (95.7%, a difference of 0.0%), Arapaho (95.7%, a difference of 0.0%), Romanian (95.7%, a difference of 0.020%), Swiss (95.7%, a difference of 0.020%), and Immigrants from Denmark (95.7%, a difference of 0.020%).
| Demographics | Rating | Rank | 9th Grade |
| Inupiat | 99.5 /100 | #75 | Exceptional 95.8% |
| Immigrants | Sweden | 99.5 /100 | #76 | Exceptional 95.8% |
| Whites/Caucasians | 99.4 /100 | #77 | Exceptional 95.8% |
| Immigrants | South Africa | 99.4 /100 | #78 | Exceptional 95.8% |
| Romanians | 99.3 /100 | #79 | Exceptional 95.7% |
| Bhutanese | 99.3 /100 | #80 | Exceptional 95.7% |
| Arapaho | 99.3 /100 | #81 | Exceptional 95.7% |
| Puget Sound Salish | 99.2 /100 | #82 | Exceptional 95.7% |
| Swiss | 99.2 /100 | #83 | Exceptional 95.7% |
| Immigrants | Denmark | 99.1 /100 | #84 | Exceptional 95.7% |
| Icelanders | 99.1 /100 | #85 | Exceptional 95.7% |
| Immigrants | Western Europe | 99.1 /100 | #86 | Exceptional 95.7% |
| Okinawans | 99.0 /100 | #87 | Exceptional 95.7% |
| Immigrants | Czechoslovakia | 98.9 /100 | #88 | Exceptional 95.7% |
| Yugoslavians | 98.9 /100 | #89 | Exceptional 95.7% |