Ghanaian vs Immigrants from Austria Professional Degree
COMPARE
Ghanaian
Immigrants from Austria
Professional Degree
Professional Degree Comparison
Ghanaians
Immigrants from Austria
4.3%
PROFESSIONAL DEGREE
27.3/ 100
METRIC RATING
192nd/ 347
METRIC RANK
6.0%
PROFESSIONAL DEGREE
100.0/ 100
METRIC RATING
37th/ 347
METRIC RANK
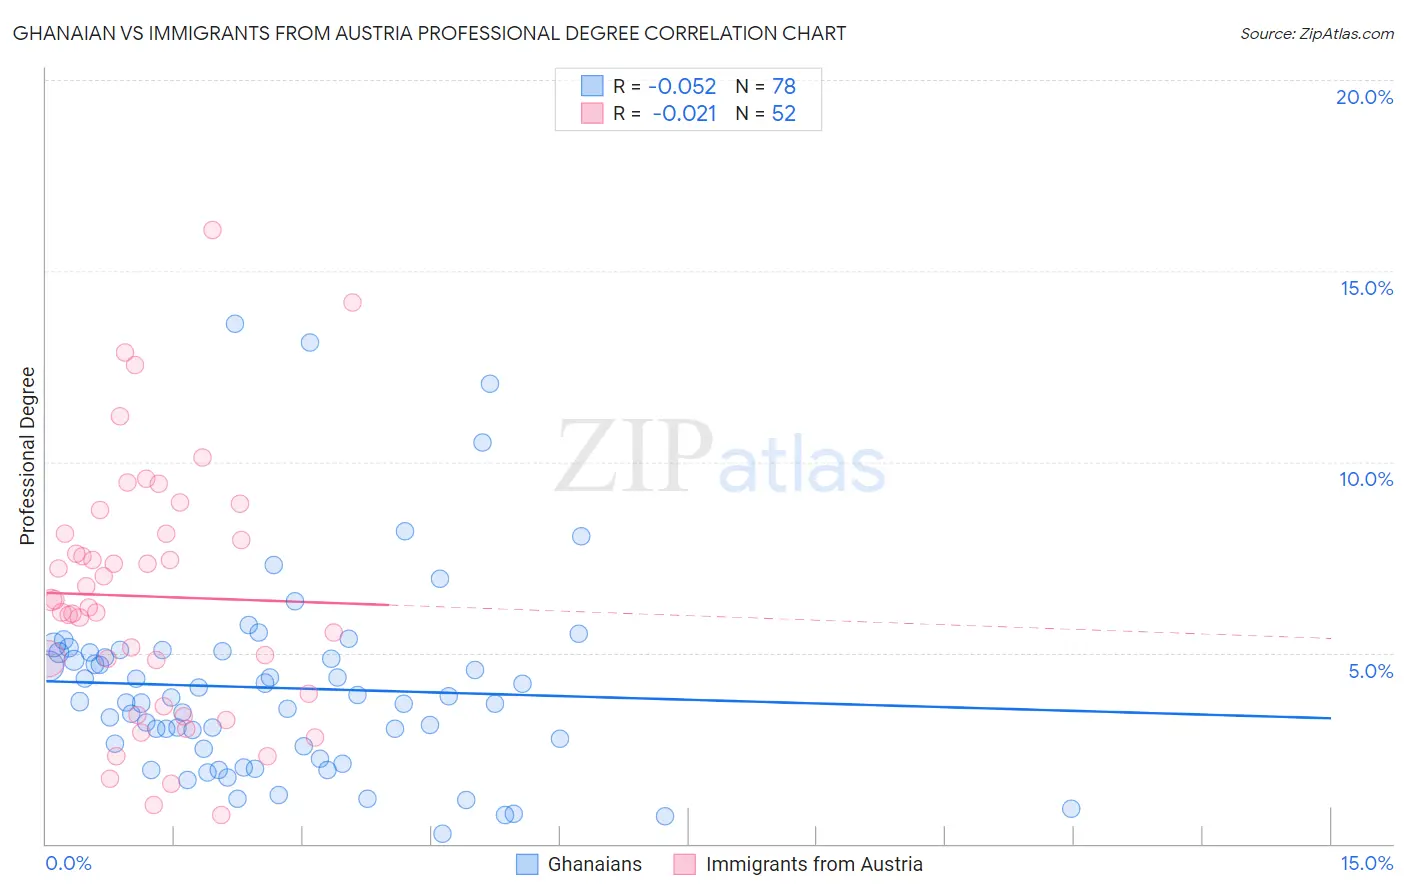
Ghanaian vs Immigrants from Austria Professional Degree Correlation Chart
The statistical analysis conducted on geographies consisting of 190,481,529 people shows a slight negative correlation between the proportion of Ghanaians and percentage of population with at least professional degree education in the United States with a correlation coefficient (R) of -0.052 and weighted average of 4.3%. Similarly, the statistical analysis conducted on geographies consisting of 167,912,662 people shows no correlation between the proportion of Immigrants from Austria and percentage of population with at least professional degree education in the United States with a correlation coefficient (R) of -0.021 and weighted average of 6.0%, a difference of 41.7%.
Professional Degree Correlation Summary
| Measurement | Ghanaian | Immigrants from Austria |
| Minimum | 0.25% | 0.74% |
| Maximum | 13.6% | 16.1% |
| Range | 13.4% | 15.3% |
| Mean | 4.1% | 6.5% |
| Median | 3.7% | 6.3% |
| Interquartile 25% (IQ1) | 2.5% | 3.8% |
| Interquartile 75% (IQ3) | 5.0% | 8.1% |
| Interquartile Range (IQR) | 2.5% | 4.4% |
| Standard Deviation (Sample) | 2.6% | 3.3% |
| Standard Deviation (Population) | 2.6% | 3.3% |
Similar Demographics by Professional Degree
Demographics Similar to Ghanaians by Professional Degree
In terms of professional degree, the demographic groups most similar to Ghanaians are French (4.2%, a difference of 0.040%), Scandinavian (4.2%, a difference of 0.29%), Sri Lankan (4.3%, a difference of 0.32%), Immigrants from Poland (4.3%, a difference of 0.36%), and Nigerian (4.2%, a difference of 0.53%).
| Demographics | Rating | Rank | Professional Degree |
| Welsh | 35.8 /100 | #185 | Fair 4.3% |
| Scotch-Irish | 34.2 /100 | #186 | Fair 4.3% |
| Immigrants | Cameroon | 33.3 /100 | #187 | Fair 4.3% |
| Immigrants | Thailand | 31.7 /100 | #188 | Fair 4.3% |
| Slovaks | 30.7 /100 | #189 | Fair 4.3% |
| Immigrants | Poland | 29.2 /100 | #190 | Fair 4.3% |
| Sri Lankans | 29.0 /100 | #191 | Fair 4.3% |
| Ghanaians | 27.3 /100 | #192 | Fair 4.3% |
| French | 27.1 /100 | #193 | Fair 4.2% |
| Scandinavians | 25.8 /100 | #194 | Fair 4.2% |
| Nigerians | 24.6 /100 | #195 | Fair 4.2% |
| Spanish | 23.0 /100 | #196 | Fair 4.2% |
| Czechoslovakians | 22.4 /100 | #197 | Fair 4.2% |
| Immigrants | Middle Africa | 22.1 /100 | #198 | Fair 4.2% |
| Norwegians | 20.5 /100 | #199 | Fair 4.2% |
Demographics Similar to Immigrants from Austria by Professional Degree
In terms of professional degree, the demographic groups most similar to Immigrants from Austria are Immigrants from Norway (6.0%, a difference of 0.20%), Immigrants from Russia (6.0%, a difference of 0.32%), Immigrants from South Africa (6.0%, a difference of 0.45%), Cambodian (6.0%, a difference of 0.92%), and New Zealander (6.0%, a difference of 1.1%).
| Demographics | Rating | Rank | Professional Degree |
| Immigrants | Turkey | 100.0 /100 | #30 | Exceptional 6.2% |
| Immigrants | India | 100.0 /100 | #31 | Exceptional 6.2% |
| Thais | 100.0 /100 | #32 | Exceptional 6.1% |
| Burmese | 100.0 /100 | #33 | Exceptional 6.1% |
| Mongolians | 100.0 /100 | #34 | Exceptional 6.1% |
| Immigrants | Korea | 100.0 /100 | #35 | Exceptional 6.1% |
| Immigrants | Russia | 100.0 /100 | #36 | Exceptional 6.0% |
| Immigrants | Austria | 100.0 /100 | #37 | Exceptional 6.0% |
| Immigrants | Norway | 100.0 /100 | #38 | Exceptional 6.0% |
| Immigrants | South Africa | 100.0 /100 | #39 | Exceptional 6.0% |
| Cambodians | 100.0 /100 | #40 | Exceptional 6.0% |
| New Zealanders | 100.0 /100 | #41 | Exceptional 6.0% |
| Estonians | 100.0 /100 | #42 | Exceptional 6.0% |
| Immigrants | Saudi Arabia | 100.0 /100 | #43 | Exceptional 5.9% |
| Argentineans | 100.0 /100 | #44 | Exceptional 5.9% |