German vs Barbadian 12th Grade, No Diploma

COMPARE

German
Race
Ancestry
AfghanAfricanAlaska NativeAlaskan AthabascanAlbanianAleutAlsatianAmericanApacheArabArapahoArgentineanArmenianAssyrian/Chaldean/SyriacAustralianAustrianBahamianBangladeshiBasqueBelgianBelizeanBermudanBhutaneseBlackfeetBolivianBrazilianBritishBritish West IndianBulgarianBurmeseCajunCambodianCanadianCape VerdeanCarpatho RusynCelticCentral AmericanCentral American IndianCherokeeCheyenneChickasawChileanChineseChippewaChoctawColombianColvilleComancheCosta RicanCreeCreekCroatianCrowCubanCypriotCzechCzechoslovakianDanishDelawareDominicanDutchDutch West IndianEastern EuropeanEcuadorianEgyptianEnglishEstonianEthiopianEuropeanFijianFilipinoFinnishFrenchFrench American IndianFrench CanadianGermanGerman RussianGhanaianGreekGuamanian/ChamorroGuatemalanGuyaneseHaitianHmongHonduranHopiHoumaHungarianIcelanderIndian (Asian)IndonesianInupiatIranianIraqiIrishIroquoisIsraeliItalianJamaicanJapaneseJordanianKenyanKiowaKoreanLaotianLatvianLebaneseLiberianLithuanianLumbeeLuxembourgerMacedonianMalaysianMalteseMarshalleseMenomineeMexicanMexican American IndianMongolianMoroccanNative HawaiianNavajoNepaleseNew ZealanderNicaraguanNigerianNorthern EuropeanNorwegianOkinawanOsageOttawaPaiutePakistaniPalestinianPanamanianParaguayanPennsylvania GermanPeruvianPimaPolishPortuguesePotawatomiPuebloPuerto RicanPuget Sound SalishRomanianRussianSalvadoranSamoanScandinavianScotch-IrishScottishSeminoleSenegaleseSerbianShoshoneSierra LeoneanSiouxSlavicSlovakSloveneSomaliSouth AfricanSouth AmericanSouth American IndianSoviet UnionSpaniardSpanishSpanish AmericanSpanish American IndianSri LankanSubsaharan AfricanSudaneseSwedishSwissSyrianTaiwaneseThaiTlingit-HaidaTohono O'OdhamTonganTrinidadian and TobagonianTsimshianTurkishU.S. Virgin IslanderUgandanUkrainianUruguayanUteVenezuelanVietnameseWelshWest IndianYakamaYaquiYugoslavianYumanYup'ikZimbabwean
Immigration
NonimmigrantsImmigrantsAfghanistanAfricaAlbaniaArgentinaArmeniaAsiaAustraliaAustriaBahamasBangladeshBarbadosBelarusBelgiumBelizeBoliviaBosnia and HerzegovinaBrazilBulgariaBurma/MyanmarCabo VerdeCambodiaCameroonCanadaCaribbeanCentral AmericaChileChinaColombiaCongoCosta RicaCroatiaCubaCzechoslovakiaDenmarkDominicaDominican RepublicEastern AfricaEastern AsiaEastern EuropeEcuadorEgyptEl SalvadorEnglandEritreaEthiopiaEuropeFijiFranceGermanyGhanaGreeceGrenadaGuatemalaGuyanaHaitiHondurasHong KongHungaryIndiaIndonesiaIranIraqIrelandIsraelItalyJamaicaJapanJordanKazakhstanKenyaKoreaKuwaitLaosLatin AmericaLatviaLebanonLiberiaLithuaniaMalaysiaMexicoMicronesiaMiddle AfricaMoldovaMoroccoNepalNetherlandsNicaraguaNigeriaNorth AmericaNorth MacedoniaNorthern AfricaNorthern EuropeNorwayOceaniaPakistanPanamaPeruPhilippinesPolandPortugalRomaniaRussiaSaudi ArabiaScotlandSenegalSerbiaSierra LeoneSingaporeSomaliaSouth AfricaSouth AmericaSouth Central AsiaSouth Eastern AsiaSouthern EuropeSpainSri LankaSt. Vincent and the GrenadinesSudanSwedenSwitzerlandSyriaTaiwanThailandTrinidad and TobagoTurkeyUgandaUkraineUruguayUzbekistanVenezuelaVietnamWest IndiesWestern AfricaWestern AsiaWestern EuropeYemenZaireZimbabweAzores
Barbadian
Race
Ancestry
AfghanAfricanAlaska NativeAlaskan AthabascanAlbanianAleutAlsatianAmericanApacheArabArapahoArgentineanArmenianAssyrian/Chaldean/SyriacAustralianAustrianBahamianBangladeshiBarbadianBasqueBelgianBelizeanBermudanBhutaneseBlackfeetBolivianBrazilianBritishBritish West IndianBulgarianBurmeseCajunCambodianCanadianCape VerdeanCarpatho RusynCelticCentral AmericanCentral American IndianCherokeeCheyenneChickasawChileanChineseChippewaChoctawColombianColvilleComancheCosta RicanCreeCreekCroatianCrowCubanCypriotCzechCzechoslovakianDanishDelawareDominicanDutchDutch West IndianEastern EuropeanEcuadorianEgyptianEnglishEstonianEthiopianEuropeanFijianFilipinoFinnishFrenchFrench American IndianFrench CanadianGerman RussianGhanaianGreekGuamanian/ChamorroGuatemalanGuyaneseHaitianHmongHonduranHopiHoumaHungarianIcelanderIndian (Asian)IndonesianInupiatIranianIraqiIrishIroquoisIsraeliItalianJamaicanJapaneseJordanianKenyanKiowaKoreanLaotianLatvianLebaneseLiberianLithuanianLumbeeLuxembourgerMacedonianMalaysianMalteseMarshalleseMenomineeMexicanMexican American IndianMongolianMoroccanNative HawaiianNavajoNepaleseNew ZealanderNicaraguanNigerianNorthern EuropeanNorwegianOkinawanOsageOttawaPaiutePakistaniPalestinianPanamanianParaguayanPennsylvania GermanPeruvianPimaPolishPortuguesePotawatomiPuebloPuerto RicanPuget Sound SalishRomanianRussianSalvadoranSamoanScandinavianScotch-IrishScottishSeminoleSenegaleseSerbianShoshoneSierra LeoneanSiouxSlavicSlovakSloveneSomaliSouth AfricanSouth AmericanSouth American IndianSoviet UnionSpaniardSpanishSpanish AmericanSpanish American IndianSri LankanSubsaharan AfricanSudaneseSwedishSwissSyrianTaiwaneseThaiTlingit-HaidaTohono O'OdhamTonganTrinidadian and TobagonianTsimshianTurkishU.S. Virgin IslanderUgandanUkrainianUruguayanUteVenezuelanVietnameseWelshWest IndianYakamaYaquiYugoslavianYumanYup'ikZimbabwean
Immigration
NonimmigrantsImmigrantsAfghanistanAfricaAlbaniaArgentinaArmeniaAsiaAustraliaAustriaBahamasBangladeshBarbadosBelarusBelgiumBelizeBoliviaBosnia and HerzegovinaBrazilBulgariaBurma/MyanmarCabo VerdeCambodiaCameroonCanadaCaribbeanCentral AmericaChileChinaColombiaCongoCosta RicaCroatiaCubaCzechoslovakiaDenmarkDominicaDominican RepublicEastern AfricaEastern AsiaEastern EuropeEcuadorEgyptEl SalvadorEnglandEritreaEthiopiaEuropeFijiFranceGermanyGhanaGreeceGrenadaGuatemalaGuyanaHaitiHondurasHong KongHungaryIndiaIndonesiaIranIraqIrelandIsraelItalyJamaicaJapanJordanKazakhstanKenyaKoreaKuwaitLaosLatin AmericaLatviaLebanonLiberiaLithuaniaMalaysiaMexicoMicronesiaMiddle AfricaMoldovaMoroccoNepalNetherlandsNicaraguaNigeriaNorth AmericaNorth MacedoniaNorthern AfricaNorthern EuropeNorwayOceaniaPakistanPanamaPeruPhilippinesPolandPortugalRomaniaRussiaSaudi ArabiaScotlandSenegalSerbiaSierra LeoneSingaporeSomaliaSouth AfricaSouth AmericaSouth Central AsiaSouth Eastern AsiaSouthern EuropeSpainSri LankaSt. Vincent and the GrenadinesSudanSwedenSwitzerlandSyriaTaiwanThailandTrinidad and TobagoTurkeyUgandaUkraineUruguayUzbekistanVenezuelaVietnamWest IndiesWestern AfricaWestern AsiaWestern EuropeYemenZaireZimbabweAzores
12th Grade, No Diploma
Income
Poverty
Unemployment
Labor Participation
Family Structure
Vehicle Availability
Education Level
Disability

12th Grade, No Diploma Comparison

Germans

Barbadians

Exceptional
Tragic
93.3%
12TH GRADE, NO DIPLOMA
99.9/ 100
METRIC RATING
19th/ 347
METRIC RANK
89.1%
12TH GRADE, NO DIPLOMA
0.1/ 100
METRIC RATING
273rd/ 347
METRIC RANK

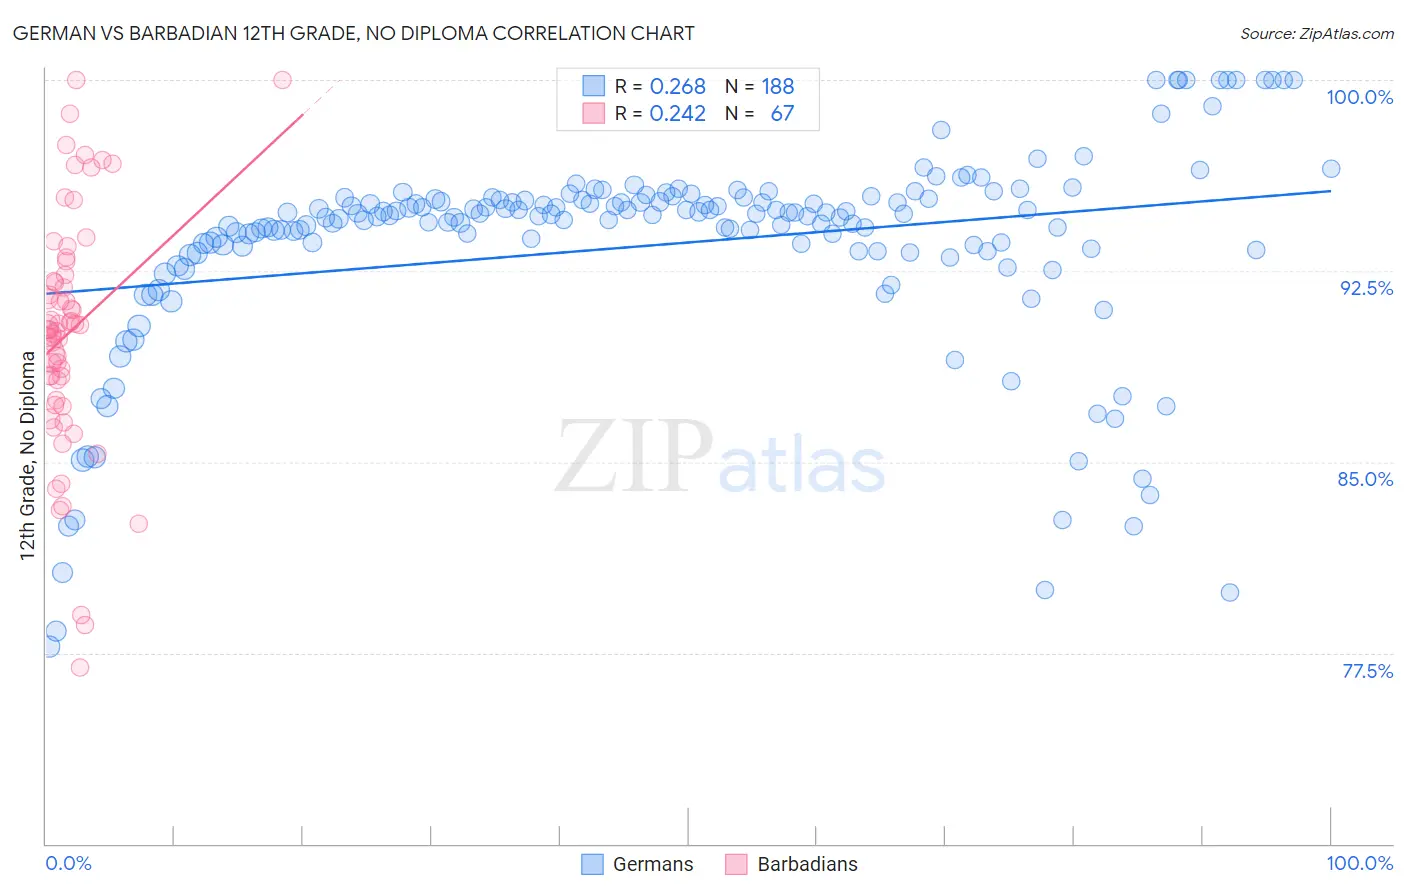
German vs Barbadian 12th Grade, No Diploma Correlation Chart

The statistical analysis conducted on geographies consisting of 581,301,284 people shows a weak positive correlation between the proportion of Germans and percentage of population with at least 12th grade (no diploma) education in the United States with a correlation coefficient (R) of 0.268 and weighted average of 93.3%. Similarly, the statistical analysis conducted on geographies consisting of 141,304,590 people shows a weak positive correlation between the proportion of Barbadians and percentage of population with at least 12th grade (no diploma) education in the United States with a correlation coefficient (R) of 0.242 and weighted average of 89.1%, a difference of 4.6%.
German vs Barbadian 12th Grade, No Diploma

12th Grade, No Diploma Correlation Summary

MeasurementGermanBarbadian
Minimum77.8%76.9%
Maximum100.0%100.0%
Range22.2%23.1%
Mean93.5%90.1%
Median94.7%90.2%
Interquartile 25% (IQ1)93.3%87.4%
Interquartile 75% (IQ3)95.3%92.3%
Interquartile Range (IQR)2.0%4.9%
Standard Deviation (Sample)4.1%4.7%
Standard Deviation (Population)4.1%4.7%

Similar Demographics by 12th Grade, No Diploma

Demographics Similar to Germans by 12th Grade, No Diploma

In terms of 12th grade, no diploma, the demographic groups most similar to Germans are Immigrants from Singapore (93.3%, a difference of 0.020%), Filipino (93.2%, a difference of 0.030%), Luxembourger (93.3%, a difference of 0.050%), Italian (93.2%, a difference of 0.050%), and Estonian (93.2%, a difference of 0.060%).
DemographicsRating | Rank12th Grade, No Diploma
Eastern Europeans
100.0
/100
|
#12
Exceptional
93.5%
Danes
100.0
/100
|
#13
Exceptional
93.5%
Bulgarians
100.0
/100
|
#14
Exceptional
93.5%
Finns
100.0
/100
|
#15
Exceptional
93.4%
Maltese
100.0
/100
|
#16
Exceptional
93.3%
Luxembourgers
100.0
/100
|
#17
Exceptional
93.3%
Immigrants | Singapore
99.9
/100
|
#18
Exceptional
93.3%
Germans
99.9
/100
|
#19
Exceptional
93.3%
Filipinos
99.9
/100
|
#20
Exceptional
93.2%
Italians
99.9
/100
|
#21
Exceptional
93.2%
Estonians
99.9
/100
|
#22
Exceptional
93.2%
Scandinavians
99.9
/100
|
#23
Exceptional
93.2%
Thais
99.9
/100
|
#24
Exceptional
93.2%
Czechs
99.9
/100
|
#25
Exceptional
93.2%
Russians
99.9
/100
|
#26
Exceptional
93.2%

Demographics Similar to Barbadians by 12th Grade, No Diploma

In terms of 12th grade, no diploma, the demographic groups most similar to Barbadians are Cajun (89.1%, a difference of 0.020%), Immigrants from Congo (89.0%, a difference of 0.090%), Ute (89.0%, a difference of 0.090%), Malaysian (89.2%, a difference of 0.13%), and Bangladeshi (89.3%, a difference of 0.14%).
DemographicsRating | Rank12th Grade, No Diploma
Seminole
0.2
/100
|
#266
Tragic
89.4%
West Indians
0.2
/100
|
#267
Tragic
89.3%
Immigrants | Trinidad and Tobago
0.1
/100
|
#268
Tragic
89.3%
U.S. Virgin Islanders
0.1
/100
|
#269
Tragic
89.3%
Bangladeshis
0.1
/100
|
#270
Tragic
89.3%
Blacks/African Americans
0.1
/100
|
#271
Tragic
89.3%
Malaysians
0.1
/100
|
#272
Tragic
89.2%
Barbadians
0.1
/100
|
#273
Tragic
89.1%
Cajuns
0.1
/100
|
#274
Tragic
89.1%
Immigrants | Congo
0.1
/100
|
#275
Tragic
89.0%
Ute
0.1
/100
|
#276
Tragic
89.0%
Immigrants | Barbados
0.0
/100
|
#277
Tragic
89.0%
Immigrants | St. Vincent and the Grenadines
0.0
/100
|
#278
Tragic
88.9%
Immigrants | Laos
0.0
/100
|
#279
Tragic
88.9%
Immigrants | Burma/Myanmar
0.0
/100
|
#280
Tragic
88.9%